


As Australia tackles its second wave of COVID-19 infections, and deals with the resulting economic impact, it is more timely than ever to understand how effective restrictions are at slowing the spread of the disease. Dr Anna Cohen and Dr Gráinne McGuire explain how recently published modelling techniques can help explore crucial ‘change points’ in the rate of community and local transmission of COVID-19 in Victoria, and what we might expect following the latest round of restrictions.
Earlier this year, German researchers (Dehning et al) published a paper Inferring change points in the spread of COVID-19 reveals the effectiveness of interventions in the journal Science. The researchers’ model looked at reported COVID-19 cases in Germany in the early weeks of the pandemic alongside publicly announced interventions. Combining a standard epidemiological model of disease and Bayesian inference, they were able to quantify the impact of publicly announced interventions to stop the spread of COVID-19. The researchers found the three successive interventions – mild social distancing, strong social distancing, and contact ban – did have a significant impact on the spread of the disease.
In the spirit of science, Dehning et al made their results and modelling code publicly available, to encourage researchers to adapt their findings to other countries or regions. With Victoria’s second wave of COVID-19 infections reaching the highest daily figure total for the pandemic last week, and a spate of measures over July to bring the disease under control, we explore how this research can shed light on the impact of changes to social distancing measures on the spread of the disease in Victoria.
What cases do we look at
In the rest of this article we look at transmission of cases acquired locally, which means:
- Acquired from someone who acquired the disease while overseas (more common in the earlier stages of the pandemic’s trajectory)
- Acquired from someone who is a confirmed case of COVID-19
- Community transmission, where someone has been infected by the disease, but hasn’t been overseas or hasn’t been in recent contact with other confirmed cases.
We don’t look at cases acquired overseas as these cases are more representative of the COVID-19 spread around the world, rather than the local transmission environment.
Victoria’s experience with community and local transmission
In the figure below, we show Victoria’s daily reported cases excluding those acquired by overseas travellers since March (data as at 9 August).
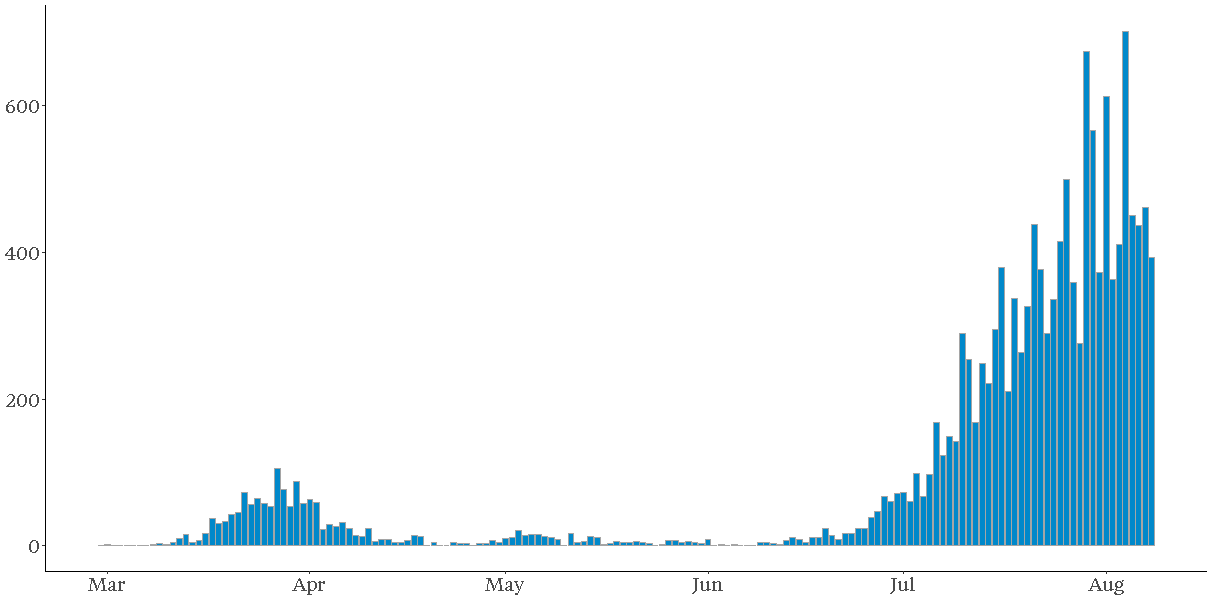
Daily reported locally acquired cases of COVID-19 in Victoria
We see:
- An initial sharp increase in cases, peaking at the end of March following initial restrictions put in place to limit indoor and outdoor public gatherings
- Daily cases declining over April, as stage 2 restrictions came into force on 25 March, and stage 3 restrictions from 30 April
- From late April onwards, an upturn of cases, with many linked to clusters including the Cedar Meats abattoir (with the first case linked to the abattoir diagnosed on 2 April) and McDonald’s in Fawkner
- Daily case numbers declining slightly over May, and following the easing of stage 3 restrictions, a steep increase in case numbers from mid-June onwards.
What did we find when we modelled Victoria’s COVID-19 spread?
Drawing on Dehning et al’s approach, our modelling takes a retrospective look at COVID-19 experience in Victoria over the period 1 May to 3 August, by measuring the rate of change of COVID-19 between key dates such as easing or re-introduction of restrictions.
In the figure below, we plot the effective reproduction number as estimated by the model, and measure the change in the reproduction number between key dates, such as easing or re-introduction of restrictions. The effective reproduction number is a measure of how many people an infected individual can pass the disease onto and it measures the trajectory of the disease. Reproduction numbers:
- Above 1 are indicative of a growing epidemic
- Below 1 correspond to decreasing numbers of new infections.
Effective COVID-19 control strategies reduce the reproduction number so that it is below 1. When the reproduction number is 1, new cases remain at a constant level.
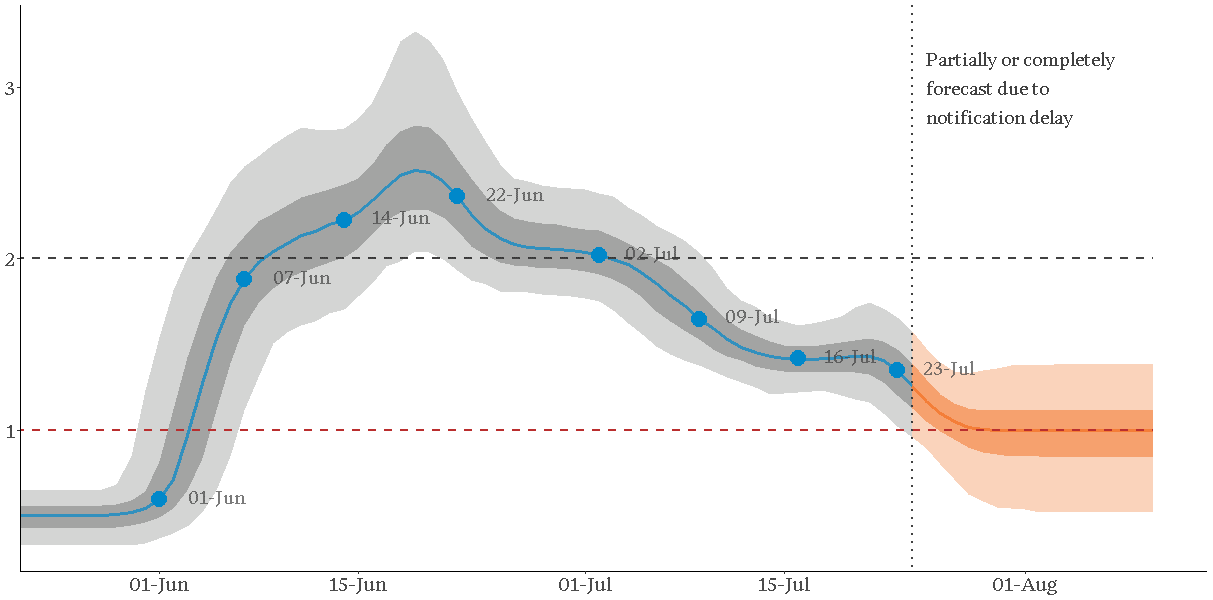
Effective reproductive number in Victoria 1 June – 3 August
Our modelling suggests the spread of the disease:
- Started accelerating around the end of May
- Continued to accelerate through the first three weeks of June, coinciding with the removal of restrictions on 1 June (restaurants and pubs were allowed to reopen with 20 patrons each, combined with the removal of restrictions on family gatherings two weeks prior)
- Slowed down following the reintroduction of restrictions on family gatherings on 22 June, but only to a point
- Slowed down further following the progressive lockdowns of Melbourne and Mitchell Shire between July 2 and July 9 but still remained above 1
- Reduced further from 23 July following the introduction of mandatory masks for all residents of Metropolitan Melbourne and the Mitchell Shire. By the end of July we estimate the reproduction number as being close to 1.
Once an intervention is introduced, the reproduction rate can take a number of days to reach its new level. In the table below we show the estimated reproduction rates that are seen after key intervention dates over June, July and August.
| Intervention date | Significance | Estimated reproduction number following the intervention |
|---|---|---|
| 1 June | Removal of restrictions on restaurants and pubs | 1.33 |
| 7 June | 1 week after removal of restrictions | 2.14 |
| 14 June | 2 weeks after removal of restrictions | 2.57 |
| 22 June | Re-introduction of restrictions on family gatherings | 2.05 |
| 2 July | Lockdowns on key postcodes in Melbourne | 1.70 |
| 9 July | Lockdown of Melbourne and Mitchell Shire | 1.41 |
| 16 July | 1 week after Melbourne and Mitchell shire lock-down | 1.43 |
| 23 July | Introduction of mandatory masks | 1.00 |
The figures in this table correspond to those in the graph above with approximately a three day delay after each intervention or measurement date. E.g. the estimated reproduction rate from the 23 July intervention of masks reaches its level of 1.00 around the 26th June.
The model results suggest that the introduction of masks was sufficient to bring the epidemic either under control (i.e. a reproduction number of 1), or close to it, but crucially was not enough to start to reduce the number of new cases.
What’s happened since?
As of the date of writing, we have plotted five further days of reported COVID-19 cases (up to 9 August) after the end of the time period covered by the model (up to 3 August). Reported cases on 4 August were much higher than forecast, but numbers on 5 – 8 August are more in line with the model forecasts, in particular, that case numbers are stabilising.
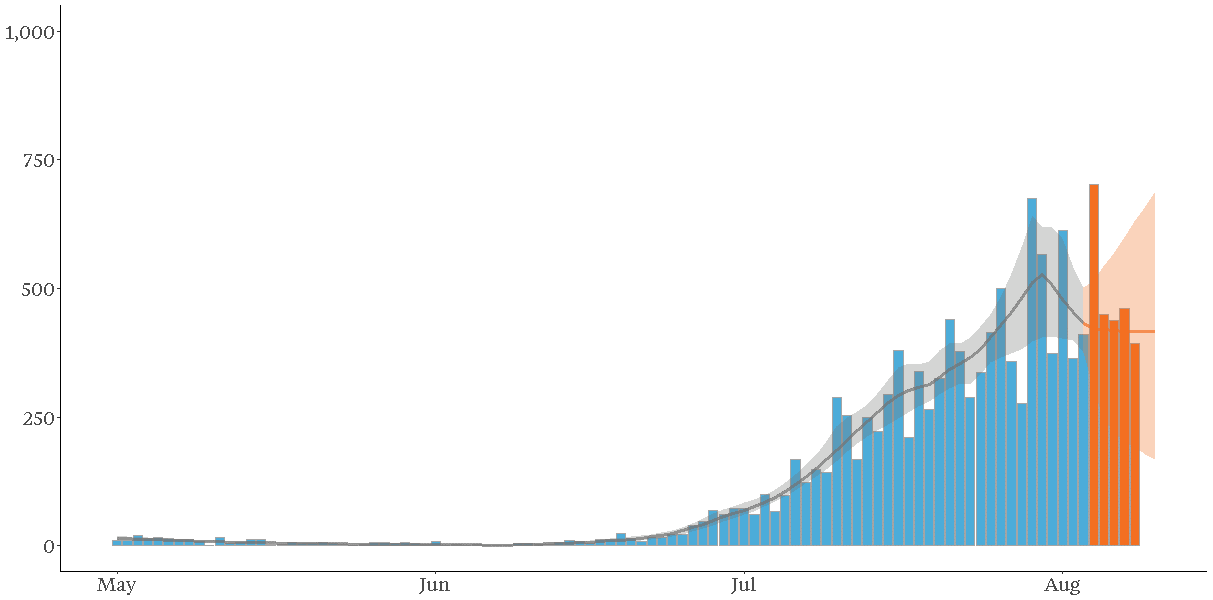
Actual and modelled daily reported locally acquired cases of COVID-19 in Victoria
What’s next?
It’s still too early to tell the impact of the most recent measures to control the spread of COVID-19 in Victoria, in particular, the declaration of the State of Disaster and the introduction of Stage 4 restrictions in Melbourne on 2 August and Stage 3 restrictions in regional Victoria on 5 August. Modelling of the latest data will allow us to measurethe impact on the reproduction rate of further restrictions.
A bit more on how we did it
The methodology outlined in the paper Inferring change points in the spread of COVID-19 reveals the effectiveness of interventions combines a standard epidemiological model of disease (the SIR model) and a list of intervention dates that result in changes in underlying epidemiological parameters change. The researchers used a Markov Chain Monte Carlo method to estimate various model parameters at different points in time, and the uncertainty in these estimates. We have replicated this work, and importantly:
- We have excluded cases identified in returned travellers in quarantine, as reported in the Victorian Government’s daily briefings
- We have assumed an approximately eight-day delay between infection and identification. This consists of the total time of incubation period, onset of COVID symptoms sufficient to warrant a test, and getting and receiving test results. Roughly speaking, this means we assume cases notified today relate to infections that took place, on average, eight days ago. Since the modelling approach uses simulations, a range of delays, centred on eight days, are used in practice.