


As fuel prices rise, more households are turning to e-bikes to manage transport costs. This shift brings a less visible consequence – a higher risk of serious injury and the long-term cost of care for injury schemes. Australian data on e-bike injuries remains fragmented, which makes it difficult for scheme regulators to judge the scale of emerging exposure. We estimate how recent growth in e-bike adoption could affect the incidence and cost of catastrophic injury care in Australia.
What are the rules for e-bike use in Australia?
Although e‑bike adoption in Australia has lagged Europe and parts of Asia, e‑bikes are increasingly viewed as a cost‑effective alternative to car ownership and a more environmentally sustainable mode of transport. Improvements in battery technology, expanding retail availability, and rebate programs in several jurisdictions have further supported uptake.
In Australia, the use of e-bikes is restricted. Most jurisdictions only permit use of power‑assisted pedal cycles (generally limited to 200 W) and electrically power‑assisted cycles (EPACs, generally limited to 250 W). Helmet use is mandatory throughout Australia, but minimum age restrictions are limited.

E-bike sales in Australia is growing
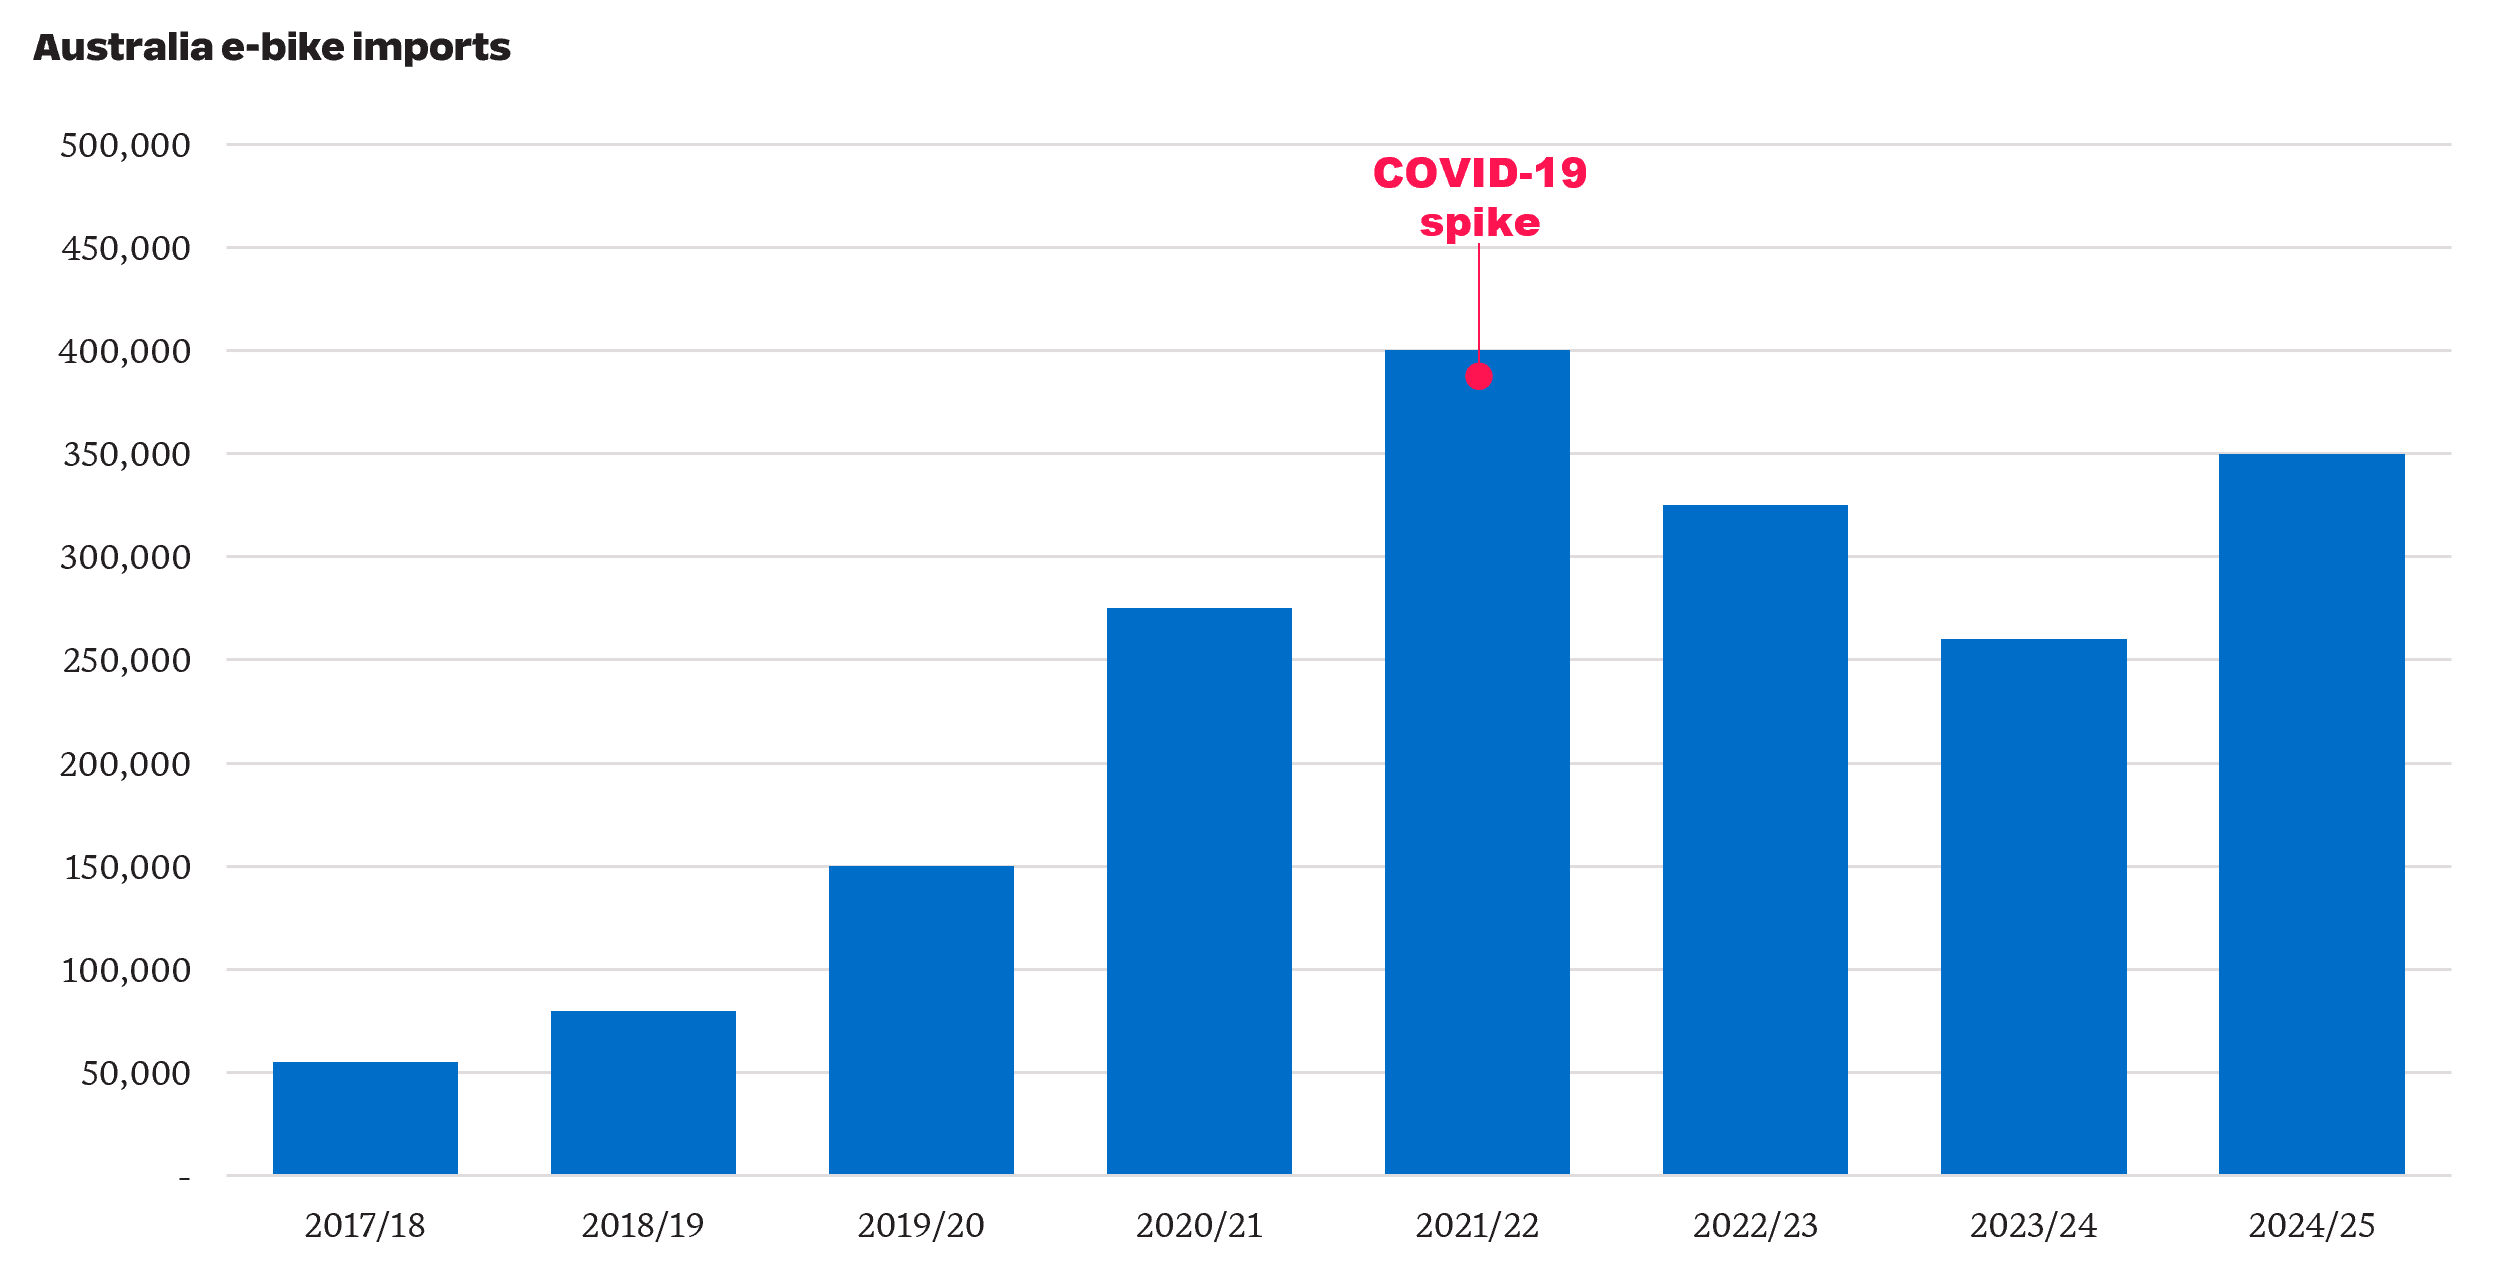
Official national sales data is not available, as e‑bikes do not require registration or licensing in Australia. However, industry reports indicate annual sales increased from approximately 9,000 units in 2017 to around 254,000 units in 2025. Import data showed a similar pattern, with e‑bike imports rising from approximately 55,000 units in 2017/18 to around 350,000 units in 2024/25. The number of e-bikes imported spiked to 400,000 in 2021/22, coinciding with the COVID‑19 pandemic, when commuters sought transport modes which enabled greater social distancing.
E-bike injuries have risen sharply
As e‑bike adoption has increased, reported injuries associated with their use have also risen. Contributing factors cited in media reports include higher operating speeds (including illegal modifications), alcohol use and low rates of helmet use.
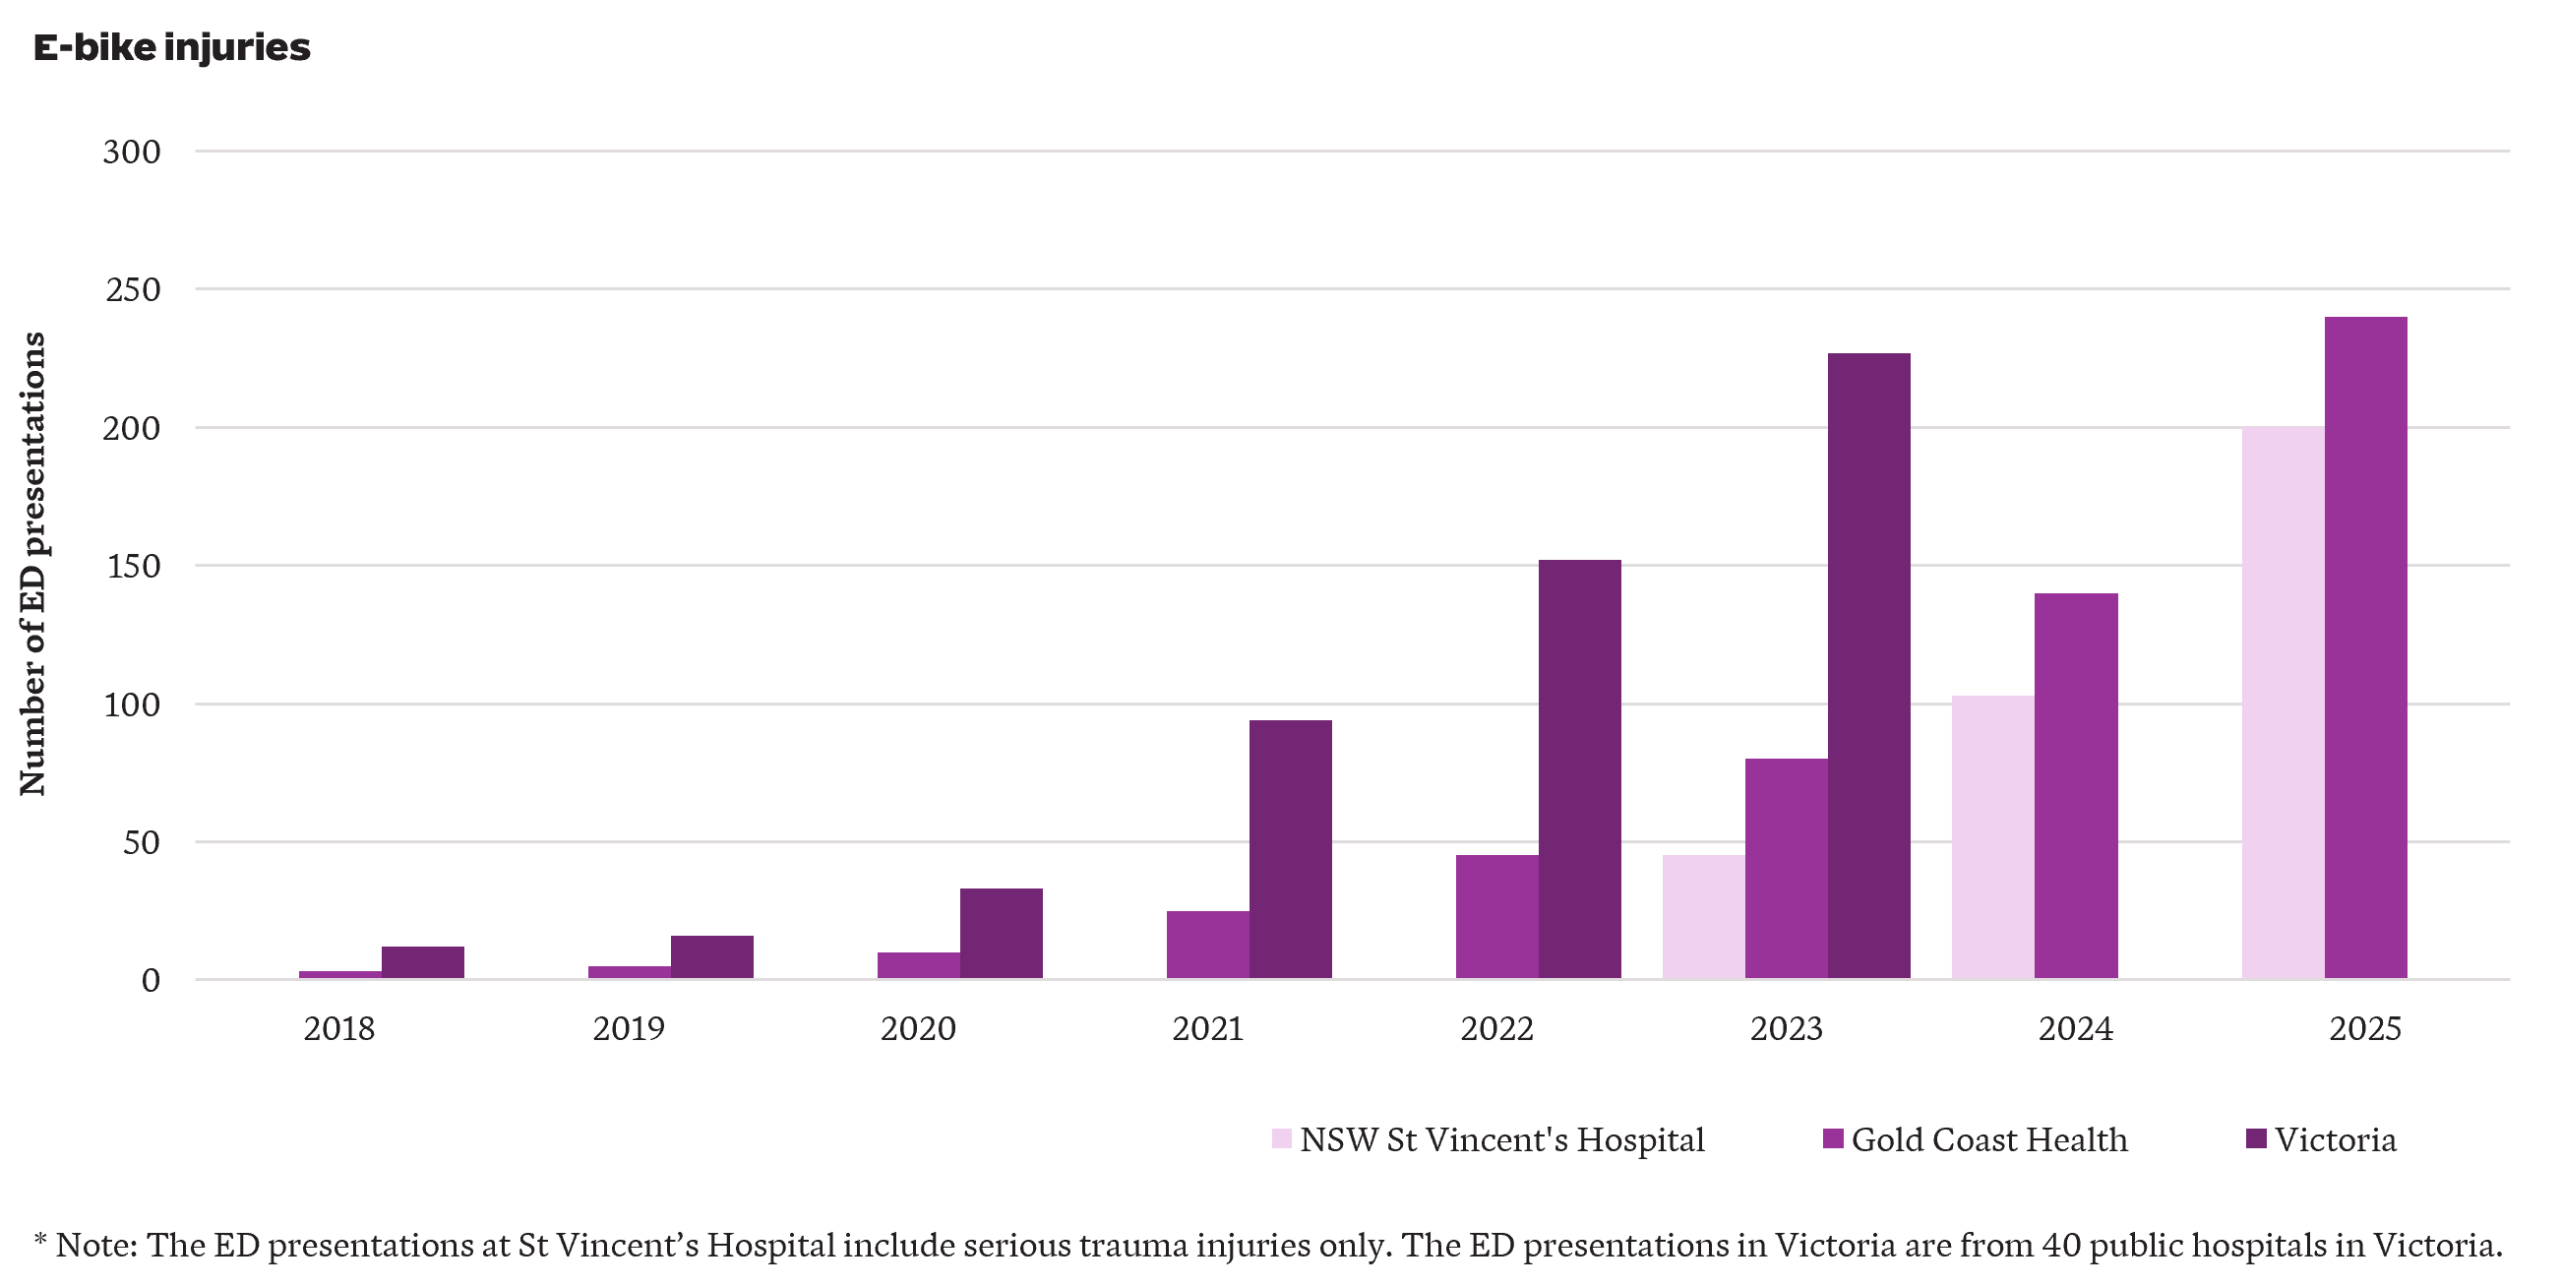
Australian data on e‑bike injuries is fragmented and incomplete, with e‑bike injuries often grouped with those from other micromobility devices e.g. e-scooters. Despite these limitations, available data consistently indicate strong growth in injuries over time – shown by growth in emergency department (ED) presentations observed at St Vincent’s Hospital (NSW), Gold Coast Health (QLD) and Victoria.
Who bears the cost of e-bike injuries?
Although rising e-bike injuries impose costs on society, who ultimately bears those costs depends on how the injury occurs. In general:
- For single-vehicle accidents, such as falls from e-bikes, the injured rider may be able to claim through private insurance, including personal accident, income protection or private health cover. If the accident occurs on private property, the rider may also be able to claim under the property owner’s home insurance.
- If a pedestrian is injured by an e-bike, they may be able to seek compensation from the rider or the rider’s public liability insurance policy where the rider was at fault. Otherwise, they may need to rely on private insurance, similar to the case of a single-vehicle accident.
- If an e-bike rider is injured in the course of work, they may be able to claim workers compensation.
- If an injury arises from the use of a permitted shared e-bike, compensation may be available under the provider’s insurance policy. Once the provider’s policy limits have been exhausted, in some jurisdictions and in some instances costs may be met through the motor accident injury scheme (e.g. the Motor Accidents Compensation Scheme in the Northern Territory).
- If an e-bike is involved in a crash with a motor vehicle, the injured user may be able to claim against the motor vehicle driver’s compulsory third party (CTP) insurer. If the injuries are catastrophic, the injured user may qualify for entry into a motor accidents lifetime care scheme.
Insurers and injury schemes bear only part of the overall cost of e-bike injuries. Where compensation is available through CTP or workers compensation, entitlements vary significantly by jurisdiction. All Australian jurisdictions provide support for the treatment, rehabilitation and care costs of people who are catastrophically injured in accidents involving a motor vehicle – and the cost of providing this support is likely to be broadly similar across jurisdictions. These are the most expensive injuries, and so we focus on projecting the indicative cost of these over the next decade.
Projection assumptions
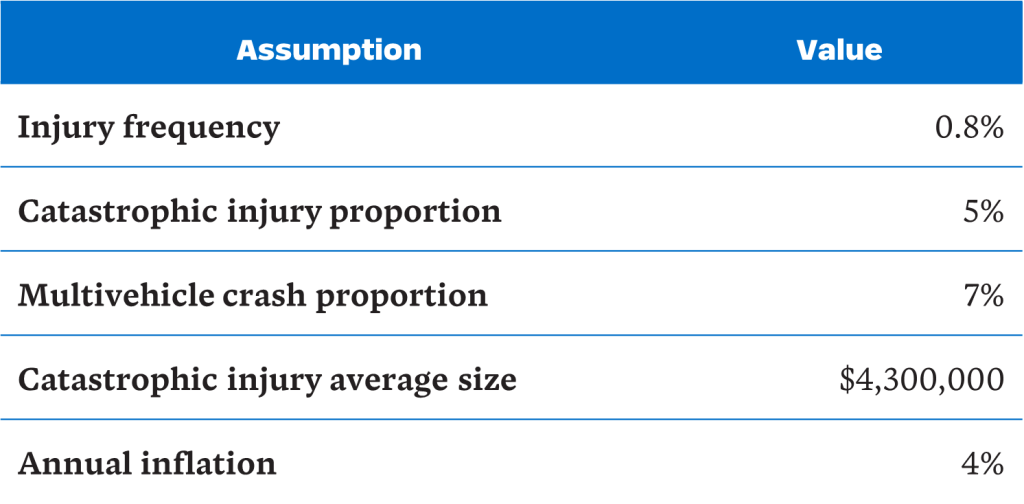
We make the following assumptions to project the cost of e-bike catastrophic injuries in Australia, discussing each in turn:
Injury frequency
We define injury frequency as Emergency Department (ED) presentations relative to the number of e-bikes owned privately. We have excluded shared e-bikes from the exposure measure as their numbers are relatively small (approximately 25,000 compared to 1 million privately-owned e-bikes). Based on available state level data, estimated injury frequencies ranged from around 0.4% to 1.3% per bike per year, broadly consistent with international experience in high uptake countries such as the Netherlands (0.6% to 0.7%). We have adopted an injury frequency of 0.8%.
Catastrophic injury proportion
Of greatest cost is the subset of injuries which are catastrophic, i.e. traumatic brain injuries (TBIs) and spinal cord injuries (SCIs). Australian and international evidence on injury severity is mixed:
- A study from Victoria found intracranial injuries accounted for around 4% of e-bike injuries whilst a Queensland study found TBIs represented around 8% of ED presentations from e-mobility devices (primarily e-scooters).
- Studies from the Netherlands reported substantially higher proportions of TBIs among e-bike injuries, ranging from 15% to 29%. Another study of younger patients found TBIs in 38% of e‑bike injuries.
- Studies from the United States suggested TBI represented 29% to 54% of e-bike injuries and spinal fractures represented 11%.
The higher TBI proportions in the international studies likely reflect non-mandatory helmet wearing and higher permitted speed and e‑bike power. Relying on the Victorian study, we assume 5% of e-bike injuries are catastrophic (comprising approximately 4% TBIs and 1% SCIs) to project the number of catastrophic injuries.
Multi-vehicle crash proportion
We estimate the proportion of injuries involving collisions with motor vehicles to project the number of catastrophic injuries eligible to enter (motor accidents) lifetime care schemes. One Australian study suggested around 6% of e-bike injuries involved collision with a car, compared to materially higher proportions overseas, which may be explained by differences in traffic conditions. Relying on the Australian study and allowing an additional 1% for crashes with non-car vehicles, an indicative assumption of 7% was adopted.
Catastrophic injury average size
The lifetime cost of providing treatment and care support for a catastrophically injured person is significant and can vary widely depending on injury type, severity, age and the availability of informal care. SCIs are generally more costly than TBIs, and injuries to younger claimants result in higher lifetime costs. Based on our experience across Australian lifetime care schemes, we have assumed an average cost of around $4.3million (in June 2025 dollars).
Annual inflation rate
We have made an allowance for treatment and care costs to increase at 4% per annum, recognising both normal cost inflation and the tendency for attendant care costs and medical expenses to increase at a higher rate (i.e. superimposed inflation).
Projection scenarios
To estimate the future cost of catastrophic e-bike injuries, we apply the above assumptions to three indicative scenarios of private e-bike usage (a base scenario and two alternative scenarios of increased usage). The scenarios are illustrative rather than exhaustive – actual outcomes may fall outside the range of these indicative estimates.
The base scenario assumes e-bike sales grow at 9.4% per annum, increasing from approximately 289,000 units in 2026 to more than 650,000 units by 2035 (based on forecasts from a market research company). We assume replacement (as e‑bikes reach the end of their usable life) every four years on average.
To illustrate the potential impact of increased e-bike usage, we constructed two alternative scenarios for comparison to the base scenario:
- Scenario A (temporary sales increase): Sales in March to June 2026 are assumed to be double what they were in the same period in 2025. From 2026/27 onwards, annual increases in unit sales are equal to the base scenario.
- Scenario B (persistent sales uplift): Sales in March to June 2026 are assumed to be 150% higher than the same period in 2025. From 2026/27 onwards, sales grow 1% higher than the base scenario i.e. at 10.4% per annum.
These indicative scenarios attempt to reflect a more recent surge in the purchase of e-bikes. Australia’s largest bicycle retailer reported a 136% increase in sales in late March 2026 compared to the same period in the previous year. This increased take-up is likely in part due to increased fuel prices (up by approximately 40% to 70% in March and April 2026) and temporary fuel shortages reported in some regions, following the outbreak of the Iranian conflict.
Our illustrative projections show:
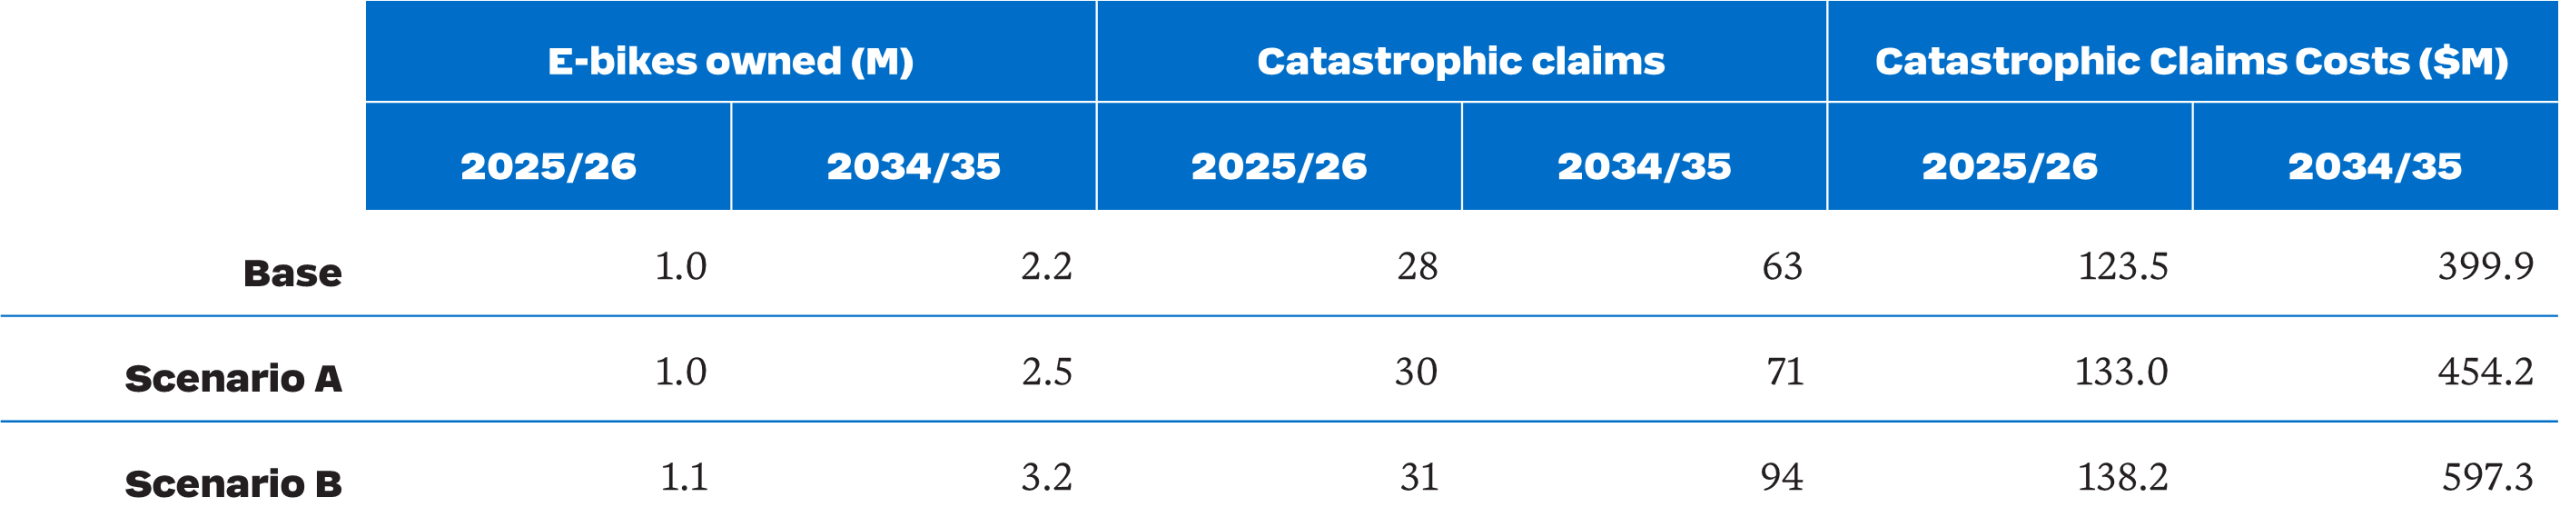
- Ownership projected to increase from approximately one million units in 2025/26 to 2.2 million, 2.5 million and 3.2 million units by 2034/35 under the base scenario and Scenarios A and B respectively.
- The number of eligible catastrophic e-bike injury scheme participants projected to more than double from 28 in 2025/26 to 63 in 2034/35 under the base scenario. By 2034/35, participants under Scenarios A and B are projected to be 71 and 94, or 13% and 49% above the base scenario.
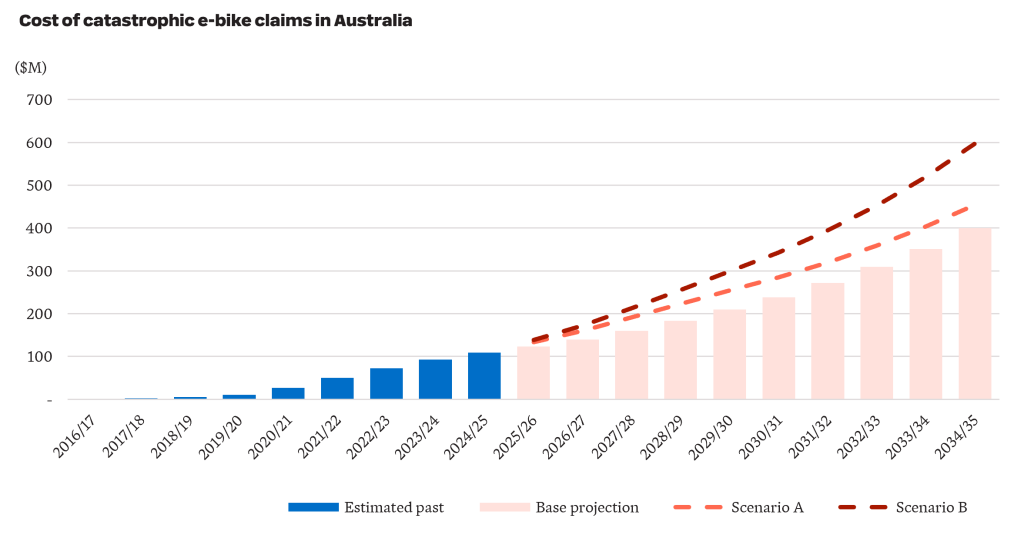
- Catastrophic e-bike injury costs incurred projected to more than triple from $124 million 2025/26 to $400 million in 2034/35 under the base scenario. Under Scenarios A and B, costs are projected to increase further (to $454 million and $597 million, respectively).
- The projected increase in e-bike use may be partially offset by substitution effects (i.e. a reduction in the number and cost of injuries associated with other road users, such as cyclists and motorcyclists).
There is recent evidence of further upward risk on costs. Data from the Sydney Children’s Hospital Network shows children presenting with e‑bike injuries increasing sharply from 33 cases in 2023 to 94 cases in 2025. Kidsafe Victoria reported a 61% increase in emergency department presentations among children aged 2 to 18 from 2023/24 to 2024/25. Catastrophic claims involving children tend to be materially more expensive, but we have not reflected this in our illustrative projections.
Regulation and policy are evolving
Regulatory settings are evolving rapidly and will influence future injury patterns. In recent years, growing concern has emerged about the safety impacts of increasing e-bike use, prompting regulators to introduce several regulatory changes. For example:
- In December 2025, the Commonwealth government reinstated the adoption of EN 15194 as the absolute national reference standard for e-bike imports.
- In NSW, proposed reforms include the introduction of a minimum rider age, a reduction in permitted e-bike power from 500W to 250W, and new enforcement powers allowing police to seize and destroy illegal e‑bikes.
- In Queensland, reforms include the application of a minimum rider age, restriction in speed on footpaths, requiring e‑bike riders to hold a valid driver’s licence, and giving police power to seize and dispose of non-compliant e-bikes. Devices with higher power/speed will be reclassified as mopeds or motorcycles, triggering registration and insurance requirements.
This evolving policy environment represents an additional source of uncertainty around future cost experience.
Overall, while e-bikes deliver benefits, catastrophic injury exposure is no longer a marginal issue. The fuel price shock associated with the Iran conflict may accelerate adoption further, bringing risks forward. Australia currently lacks a uniform national framework for e-bike regulation and data collection, which makes analysis difficult. Improved data collection, ongoing monitoring and coordinated policy responses will be essential to manage these emerging costs before they become entrenched – and substantially more expensive.