Category: Uncategorized

  • Analytics quick wins: Five New Year resolutions to thrive in a climate of economic uncertainty

    How can advanced analytics help you through the COVID-19 storm? We reveal some ways to strengthen your business and prepare you for long-term success.

    The global spread of COVID-19 has created a financial and healthcare crisis no one seemed fully prepared to meet. As stimulus programs wind down, the extent of the consequences will become clearer.

    On the economic front, most businesses have reviewed their costs and made changes to protect their long-term future, with the burden often falling on employees in the form of job losses and reduced hours.

    In March, US weekly jobless claims reached a peak of nearly seven million. Before COVID-19, that figure had not exceeded 700,000 since the 1960s.

    But job counts tell only part of the story. According to the World Economic Forum, 11.7% of working hours have been lost in the first three quarters of 2020, with the impact felt disproportionately by low-income earners.

    Now is a perfect time to consider making some New Year analytics resolutions

    Broaden your thinking
    As business leaders struggle in this tough economic climate, reducing their cost base is an understandable response to reduced demand and increased uncertainty, but it’s not the only way to survive. Consider, for example, the opportunities advanced analytics present in this new environment. COVID-19 has turbocharged digital transformation and changed the way consumers think about product/service delivery. A year ago, no one could have predicted the rapid rise in telehealth, for example.

    As we leave 2020 behind, now is a perfect time to consider making some New Year analytics resolutions.

    Resolution 1: I’m going to boost my organisation’s analytics capability

    The ability to optimise business settings typically reflects the maturity of an organisation’s analytics capability. Most attempt to gain an edge through the proliferation of their customer data. However, the degree of sophistication to harness the potential of those enormous datasets varies significantly. Are your analytical outputs still all focused on retrospective analysis of the past? Or have you moved into future orientated predictive and prescriptive analysis as represented in the chart below?

    Capability Chasm

    Source: Based on an original chart by Erik Marcade, SAP

    Quick wins stem from thinking about actions that move you towards the next level of maturity.

    Focusing your BI reporting in the right places
    Most organisations will employ business intelligence (BI) reporting to help management understand what is happening in the business. An increasing number of entities now employ interactive BI reporting and visualisation tools to allow users to delve into the BI data and try to understand the reasons behind what is happening.

    When developing your BI reporting process, it’s important to think about the measures you track and report, and how they relate to one another. This will increase the focus of your reporting as well as the value of your data, and ensure you’re not swamping users with too much information. It might help to consider BI reporting as a hierarchy of measures categorised as:

    • End outcomes that determine business fundamentals – for example, product sales and revenue
    • Lead indicators that give early clues as to how the end outcomes will perform in the future – think about your end-to-end product sales and customer lifecycles to derive these. For example, home-loan approvals as a lead indicator of home-loan drawdowns.
    • Behavioural indicators – tracking how your customers interact (or don’t interact) with your business and the activity of your sales staff will help inform future operations that ultimately determine end outcomes. For example, the number of customers using online sales channels.

    No time like the present to develop your predictive analytics
    Increasingly, public and private sectors are using predictive analytics to guide decision-making. If your organisation has yet to make that step, now might be the time to start. It doesn’t have to be hard or complex. You might consider one business problem, such as customer retention, and see how a machine learning solution can improve your customer engagement strategies, for example, by identifying customers that are most likely to take their business to a competitor in the near-term.

    If you don’t have in-house capability, external advice doesn’t have to be an elaborate process to add significant value.

    Regardless of where you are on the maturity scale, the next incremental step might be quick and rewarding.

    Resolution 2: I’m going to shift my thinking on my customers from short-term to long-term

    Unlocking long-term customer value is one of the greatest analytical opportunities for many businesses.

    This is particularly true for industries where people have a long-term ongoing need for the product or service, and the opportunity to differentiate from your competitors is relatively limited.

    Telcos, utilities, banking, insurers and other financial service providers are good examples.

    All businesses will have a focus on their near-term financials. The current-year profit-and-loss account and balance sheet will always retain its allure as they headline the next set of financial statements market participants see.

    However, near-term financial incentives are often inconsistent with realising long-term customer value. For example, young banking customers (teenagers and students) tend to generate relatively little revenue for banks. With a near-term focus, a bank might invest relatively little in these customers. However, later in their lives they will need more valuable banking products such as a home loan. A long-term focus would see greater investment in these customers in recognition of their long-term customer value.

    Unlocking long-term customer value is one of the key analytical opportunities for many businesses

    Strategies with lasting appeal
    To achieve a pricing and loyalty strategy that maximises long-term shareholder value, it’s essential to understand which individuals will deliver high or low long-term value.

    When you achieve this, you can target your product pricing so you don’t miss potential revenue opportunities or discount in way that cannibalises existing revenue more than it encourages new sales.

    Additionally, paying attention to existing customers can help avoid the predictable customer attrition that occurs when the business focuses mostly on potential new customers.

    Getting the balance right with your pricing and loyalty strategy is a fine art – not just a matter of luck – requiring well-directed customer analysis that could significantly improve your strategy. It could also have major positive ramifications for your customer and shareholder value.

    Resolution 3: I’m going to tailor my analytics solution to the problem at hand

    Off-the-shelf advanced analytical products are typically slick in their presentation and the way they can be implemented in your IT infrastructure. They are built with this in mind to appeal to as broad an audience as possible.

    There are plenty of use cases where these can be of great benefit, but sometimes, a generic solution won’t give you the answers to a complex business problem. For example, a retention prediction model might highlight customers who are most likely to take their business to a competitor but offer no insight on what to do about it. In these cases, you may want to consider a tailored solution where you have a need for greater insight.

    A tailored solution can explicitly incorporate your specific product, delivery channel, customer and/or market location factors.

    An advantage in doing things differently
    No two businesses are the same and their analytical solutions shouldn’t be either. Sometimes competitive advantage can stem from doing things differently with your analytics approach.  For example, if your advanced analytics approach allowed you to understand the long-term value of your customers better than your competitors, your business decisions informed by this might yield greater long-term shareholder value.

    Resolution 4: I’m going to gain deeper insight through personalisation

    More and more businesses are attempting to personalise their pricing, marketing and services. If done well, engaging customers with a personalised approach and remaining relevant to their needs is a great strategy.

    Some guiding principles to focus your strategy
    To gain the most out of personalisation, keep two key questions in mind:

    • Is my personalisation approach deep enough to make it genuinely personal?
    • Have I considered whether my approach will generate overwhelming negative sentiment about the business?

    Personalised marketing is a good example. We’ve all received marketing emails from businesses that attempt to talk to us as if they know us and who we are. Most of the time these miss the mark. Broadly speaking, businesses accept this. The product sales from the minority that do engage with the marketing is deemed to be worth it.

    Does the upside outweigh the downside?
    Do you understand the power customers may have to affect your business when they don’t engage? The best case is that they are ambivalent to the engagement. But some will view it negatively and attach negative sentiment to the experience and your business.

    Have you tried to establish whether the upside from customers who engage with a personalised approach outweighs the downside from customers who view the engagement negatively?

    A quick review of your personalisation approach may be very enlightening and change the way you think about engaging with your customers.

    With some thoughtful preparation, you can set up a rigorous governance structure

    Resolution 5: I’m going to make sure our analytics governance structure is rigorous

    Many businesses use machine learning and other models to support decision-making, often in real time. In the haste to deliver, it can be easy to overlook putting adequate model governance in place, which can expose your organisation to significant risks. Take, for example, Amazon’s AI recruitment tool from 2014/15, which was biased against women. The tool was built using data from CVs over the prior 10-year period and so reflected male dominance in the tech industry.

    With some thoughtful preparation, you can set up a rigorous governance structure based on these essential components:

    • Risk management framework – Including risk appetite, risk monitoring and controls
    • Governance guidelines – For system design, privacy and fairness guidelines, for example
    • Tracking – Of modelling system performance, changes, accountability and incidents
    • Audit and review – To ensure ongoing fitness for purpose and value realisation.

    Any business can be vulnerable to governance weak spots, especially during times of economic uncertainty. The following considerations highlight common areas of concern that you can address to help strengthen your governance structure:

    1. Design – Have you correctly formulated the model to solve the intended business problem?
    2. Operations – How is the model performing in its regular course of operation? This includes people processes, such as oversight, authorisation, and processes to maintain their performance, as well as systems that support the infrastructure.
    3. External issues – Are there any changes outside of the bounds of the model? This includes changes to upstream and downstream processes that cause the model to behave differently from its original design and intention.
    4. Community and regulatory expectations – Does your model meet expected standards? This includes privacy, fairness, and regulatory conditions, such as those governing the sale of financial products.

    Simple steps towards a robust framework
    Putting in place a good governance structure doesn’t have to be hard. A quick review of your current structure will help ensure you are maximising the value from your modelling infrastructure. It will also help ensure you are minimising the risk of experiencing a damaging governance failure at a time when your business may be less resilient than normal to shocks.

    Analytics quick wins – where do you start?
    By having a conversation. Get your stakeholders in a room and think about your analytics strategy and the potential opportunities raised in this article.

    Many businesses have invested heavily in their analytics capability over the past few years. Arguably, economic uncertainty is when this should pay most dividends, as you look to secure your short-term future and position well for the recovery.

  • A practical business guide to the new design and distribution obligations (DDO)

    ASIC’s new DDO regulations offer firms a chance to realise greater business value as well as greater connection to their customers, despite attributing more accountability to distributors.

    On October 5, the new DDO are due to take effect, outlining product design, distribution and monitoring requirements for organisations – and placing consumers at the heart of product governance. The requirements essentially challenge the assumption that suitable disclosure leads to informed consumer decision-making. In doing so, DDO place obligations on product issuers and distributors to ensure their products meet consumer needs.

    Regulatory Guide 274 sets out ASIC’s interpretation of DDO requirements, expectations for compliance and approach to administering the obligations. The customer-centric approach provides product issuers with a timely opportunity to use their data to best effect. The challenge for product issuers and distributors comes from how to establish effective frameworks that meet DDO requirements and add value by October.

    In this practical guide, we help product issuers navigate their way through the DDO regulations, and suggest ways they can use their data to:

    • Inform the Target Market Determination (TMD) for each product
    • Monitor compliance with DDO requirements on an ongoing basis
    • Move beyond compliance and create value through meeting DDO requirements.

    Step 1: What information should I consider to inform the TMD?

    Firstly, it’s important to define a target market. A target market is defined by the product issuer, who must assess their product as consistent with the objectives, financial situation and needs of a group or ‘class’ of customers. Distribution conditions must be specified, to make it likely that consumers who acquire the product are in the target market. Issuers and distributors must take ‘reasonable steps’ to ensure distribution is consistent with the TMD.

    Setting a suitable definition of ‘class’ of customers, changing systems to capture additional information if required and establishing a suitable monitoring framework takes time. To meet TMD requirements, ASIC considers that product issuers will generally need to:

    • Describe the likely objectives, financial situation and needs of consumers in the target market
    • Describe the product features
    • Explain why the product features are likely to meet consumers’ needs.

    Unlike personal advice, design and distribution obligations do not require product issuers to assess the suitability of products for individual consumers. As mentioned earlier, consideration needs to be given to the likely objectives, financial situation and needs of a class of consumers. However, ASIC does expect issuers to specify the target market with sufficient granularity and to have tested its product. In some cases, it may be necessary to define the target market as including some classes of consumers and excluding others.

    There’s a range of information that product issuers can use to help define the target market. The information available will depend on whether the product is new or existing, and whether the issuer distributes the product directly to consumers or whether distribution occurs through a third party. The following table provides examples of the information organisations may want to consider.

    ExperienceProduct designCustomer / risk information
    – Reported claims
    – Accepted claims
    – Declined / withdrawn claims
    – Paid claims
    – Lapse rates
    – Disputes + outcomes
    – Exclusions
    – Coverage limits
    – General and claims conditions
    – Deductibles
    – Premium charged
    – Eligibility
    – Asset insured
    – Location
    – Policyholder age
    – Employment status
    – Life stage
    – Objectives

    Product issuers should consider how customers’ needs change over time. For example, a comprehensive car insurance policy issued today on a 15-year-old Holden may no longer be appropriate, despite the product being fit for purpose when the car was new.

    Ultimately, it may be necessary to ask additional questions to ascertain whether a consumer is in the target market and to respond appropriately when customers volunteer relevant information. The law provides an exemption from personal advice obligations to determine whether or not a consumer is in the target market.

    Step 2: How do I monitor compliance with DDO requirements?

    Monitoring compliance with DDO requirements involves:

    • Monitoring whether the product reached consumers in the target market. If it has not reached the target market, why not?
    • Assessing how the product performed for consumers. That is, did the product meet consumers’ objectives and needs?

    A TMD must specify suitable review triggers, such as loss ratios consistently falling below a level that indicates diminishing value for the class of consumers. Monitoring performance against these review triggers will support product issuers in deciding whether changes to the product and/or distribution are required. It will allow businesses to make responsive, data-informed decisions that will ultimately benefit their bottom line, and ensure they are in tune with their customers and their concerns.

    Bundled products (such as home and contents cover) should also be considered separately …
    Assessing whether the product has reached the target market

    Provided the target market is well defined, it should be straightforward to assess whether a product has reached the target market, with ASIC emphasising the importance of measuring consumer experience by distribution channel. Bundled products (such as home and contents cover) should also be considered separately as the target market for the combined product is narrower than the market for the two separate products.

    ASIC’s regulatory guide states that issuers and distributors are not assessed as having failed to take reasonable steps because a consumer outside the target market acquires the product. Instead, ASIC’s concern is when a significant amount of distribution is occurring outside the target market, or the distribution is leading to consumer harm. In these circumstances, the product issuer needs to report the significant dealings to ASIC.

    Assessing consumer outcomes

    There’s considerable overlap between the metrics considered to determine the target market for existing products and those used to assess consumer outcomes. In the following table, we list a series of questions for product issuers to consider. Again, it is important to measure consumer outcomes by distribution channel. It may also be necessary to further segment the portfolio by risk or customer type – for example, customer tenure, geographic location of risk insured or customer age.

    QuestionsMetric
    Is a reasonable percentage of premium returned to the customer in the form of claim payments given the risk? That is, what is the financial value of the product to consumers?Gross loss ratio
    Are customers able to claim on the product when they need to? Consideration of rejected and withdrawn claims will inform an assessment of whether distribution practices and/or product terms and conditions are suitable.Rejected claims*

    Withdrawn claims
    Are products meeting consumers’ objectives? If not, where are the frictions?Volume and nature of complaints*

    Complaint outcomes
    Do consumers continue to see value in the product?Policy lapse rates

    Policy cancellation rates

    * We suggest monitoring rejected claims, withdrawn claims and complaints both in absolute terms and as a rate. Monitoring these metrics as a rate accounts for differences in product penetration and facilitates comparison between products.

    Product issuers need to consider what is a reasonable range for each metric, and the timeframes for measurement, to determine when action is required.

    Step 3: How do I capture the opportunities associated with meeting DDO requirements?

    There are several factors critical to moving DDO requirements away from a pure compliance exercise, towards a process that provides value. These are:

    • Senior management driving the process and engaging with stakeholders across underwriting and pricing, distribution, claims management, product management and actuarial.
    • Analysis of existing data to identify frictions in the provision of products. There are a range of data sources that can be analysed to improve design outside of meeting DDO requirements – customer enquiries data, for example.
    • A robust debate around suitable metrics to measure consumer outcomes and appropriate triggers. For example, setting a loss ratio trigger, which allows a product issuer to measure whether a reasonable percentage of premium is returned to the customer. This is a useful step in checking whether products are delivering value for consumers.
    • Reporting that is modified, as necessary, to embed consumer-focused metrics. It is important that consumer-focused metrics are tracked and shared across the various functions. Well set up monitoring should help issuers identify early trends or erosion in customer value and enable remedial action to be taken before it becomes a major issue. Just as the Board receives regular financial snapshots, we advocate for the Board to receive a regular summary of customer-focused metrics.

    A well-designed approach to meeting and monitoring DDO requirements should create value for product issuers and distributors. DDO provide product issuers with a great opportunity – to truly connect with their customers and their needs – this can only be a good thing for our industry.

  • Finding the fairness in ethical machine learning

    Are we headed for a dystopian sci-fi scenario where machines make all our decisions? In this second instalment of our two-part series, we discuss what it means to be fair in ethical machine learning, the surprising ways bias creeps in and why it’s so important to keep humans in the loop.

    Governments and businesses around the world are increasingly concerned with ensuring the fair and ethical use of machine learning. Most strikingly, in the United States, Facebook and Twitter have taken some actions around the recent presidential election to flag or remove disinformation – setting aside the question of whether their responses are sufficient and proportionate – notably Twitter’s removal of Donald Trump’s account.

    In Australia and New Zealand, we have also seen significant developments in government, including some relevant local developments:

    • In July 2020, New Zealand released its Algorithm Charter for Aotearoa New Zealand, which is essentially a call to action for public agencies to provide New Zealanders with the confidence that algorithms (and AI) are being used sensibly and ethically. We have discussed this in a separate article, Algorithm Charter for Aotearoa: six things to be doing now
    • In August 2020, the NSW Government effected the NSW AI Ethics Policy to guide the use of AI in the public sector. This defines mandatory ethical principles for the use of AI by NSW government agencies.

    The right strategy – where can organisations begin?

    For boards and management keen to address the issues of fairness in their data and technology, first, it’s critical to ensure human oversight to implementing ethical processes and a good governance structure. This will help establish appropriate people with responsibility for the fair application of machine learning, who can take action if problems arise. After that, there are four key considerations:

    • Fairness – Is your system as a whole fair?
    • Privacy and data ownership – Do you have permission to use the data for this particular task? Are you at risk of exposing private information?
    • Transparency – Do the users of the system and people affected by decisions or outcomes from the system understand why particular decisions are made? For high-stakes decisions, interpretable models may help (see our previous article, Interpretable machine learning: what to consider)
    • Accountability – How can those impacted by decisions understand and challenge them? Is there an avenue for redress? Who is responsible for the appropriate use of the algorithm?

    What do we mean by fairness anyway?

    Drawing on the parallels with Just War Theory (discussed in Part 1 of this series), fairness means that the overall action is justified and the way we implement it is ethical. Furthermore, many actions have positive and negative impacts so it’s important to also consider the principle of proportionality – are the benefits proportional to the possible harms?

    Thus, the first step is to decide if you are justified in using machine learning at all. Assuming you consider that you are, then the next step is to ensure that the process as a whole is implemented fairly. This in turn means you need to decide how fairness is defined in your particular context.

    Fair is not fair
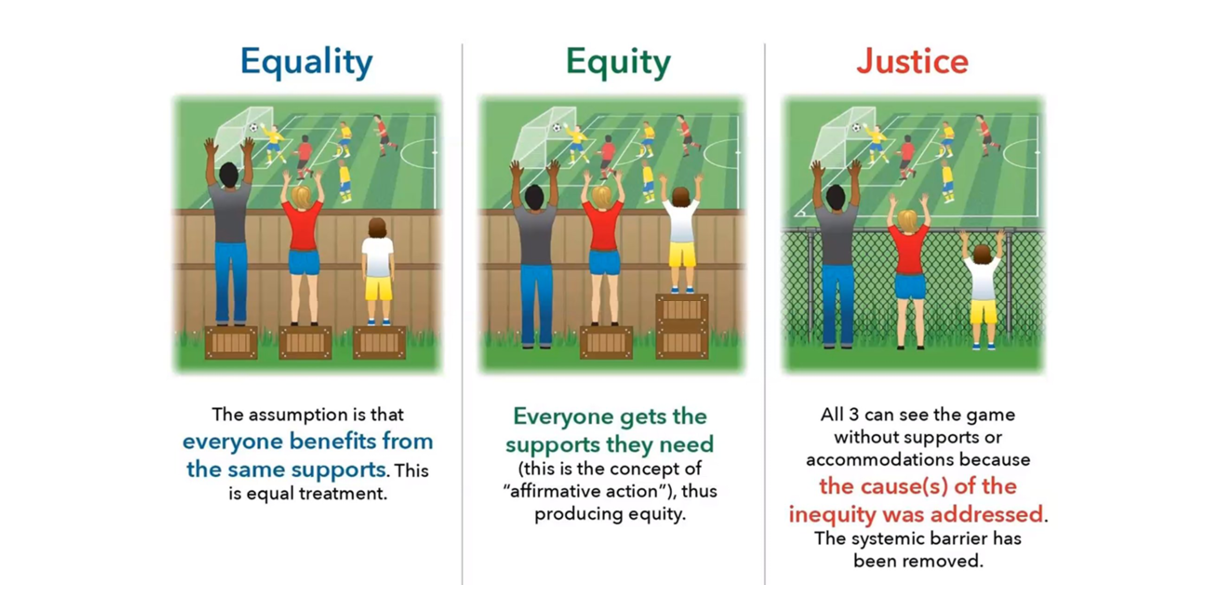
    At a high level, we might say fairness means treating everyone equally. But if we drill down into details, what do we really mean by this? Let’s suppose we want to make a decision for a group of people and we want to treat men, women and non-binary fairly, that is, we don’t want to discriminate on the basis of gender. Suppose also that we plan to use a process to select some people for assistance to combat disadvantage suffered by them. In order to be fair for all, does fairness mean that:

    • We give exactly the same assistance to each individual? (Also known as formal equality)
    • We give differential levels of assistance so that, overall, everyone ends up in a similar position after the intervention? (Substantive equality)

    ‘At a high level, we might say fairness means treating everyone equally … ‘

    *Image source

    The answer is it depends on our aims and what we want to achieve. Fairness is very context dependent. What is right in one situation may not be the fair choice in another. For example, if a bank is considering whether to give someone a loan or not, then most of the time we’d probably view equality of treatment between genders as equitable. However, often gender is important and differential treatment might actually be a fairer option than identical treatment for all.

    A Swedish lesson
    In her book Invisible Women, Caroline Criado Perez gives a fascinating example where snow-clearing in Sweden was found to discriminate against women. A gender-equality initiative in 2011 meant that the town of Karlskoga in Sweden had to evaluate all policies for gender bias. No one had considered a gendered aspect to snow-clearing before in the town but once they did they realised that the usual snow-clearing policy (starting with major traffic arteries and working down to pedestrian and bicycle paths at the end) did affect men and women differently.

    The difference was in their travel patterns. Basically, men are more likely to drive in a twice-daily commute (pre-COVID-19, anyway), while women are more likely to make frequent shorter journeys closer to home and on foot, or by public transport, due to their greater share of unpaid care work of children and the elderly. The town councillors decided, on the basis of this difference, to prioritise clearing the footpaths and public transport areas – it’s much harder to walk through snow, especially with a buggy or pram than to drive through it.

    The story doesn’t end there, though, because what actually happened is the authorities ended up saving money – wintertime hospital admissions for injuries were dominated by pedestrians falling in icy conditions, so these were greatly reduced. While this isn’t an example of a machine learning decision process, it does illustrate some of the nuances in considering the question of fairness for different groups.

    ‘No one had considered a gendered aspect to snow-clearing before in the town … ‘

    Defining fairness at the outset
    Getting back to your problem at hand – how to decide if your system is fair: agreeing with stakeholders what exactly you mean by fairness for the particular process or system is a critical conversation to have early on. It’s important to cast the net far and wide to try to consider as many relevant issues as possible. The answer will depend on the context and usually there will need to be some trade-offs. Unsurprisingly, there are no hard-and-fast rules for determining what type of fairness to use, but these rules of thumb may be helpful:

    • If your process is assistive, then you should be concerned with errors of exclusion – you don’t want to exclude people from receiving help in a biased way
    • Conversely, if your process is punitive, then including people in error usually leads to greater harm.

    Fairness through unawareness
    Often people suggest ‘fairness through unawareness’ as a quick fix to removing bias. This is where the modelling process ignores the protected characteristic. There’s a subset of cases where this will work, but you still need to collect information on the characteristic so that you can review the process for fairness. However, a lot of the time it will fail – even if you have concluded that the fair thing is to treat genders equally, omitting gender from your model may not achieve this – other variables may act as proxies for gender.

    Of course, fairness through unawareness is unsuitable for cases where the ethical action is to take account of differences in gender. An example of this is in medical diagnoses, where diseases can present differently in males and females.

    But models are objective, aren’t they?

    One argument put forward in support of using algorithms for decision-making is that they are more objective and remove subjective human decisions. The trouble is that models are built on data – essentially, they identify patterns in the input data and use these patterns to make predictions about new data. While this can be valuable when the input data is ‘clean’ and free from bias, if we feed biased data in, then the model will perpetuate these biases.

    Unfortunately, we know the world has systemic biases – if algorithms are applied at scale, they can do significant amounts of harm. Cathy O’Neill provides many examples in her book, Weapons of Math Destruction, including the United States example we mentioned in Part 1, where a US magazine unintentionally altered the tertiary education environment in the 1980s.  The Swedish example, above, highlights the nuances of bias – often the presence of biases are not readily apparent.

    The problem with patterns in crime
    One of these concerns predictive policing machine learning tools, which are frequently used in the US. Some look at patterns of crime in an area and can be useful for preventing burglaries and car theft.

    However, if the systems are set up to include more minor or nuisance crimes, then fairness problems can creep in. These types of crimes generally go unreported if there are no police present to see them. While they can occur in all areas, they are usually more frequent in impoverished districts and this sets up a destructive feedback loop.

    More police are directed to these impoverished areas, in turn detecting more minor crime, which feeds into the model to direct even more police to the area. Those affected get caught up in the penal system, often for crimes that are ignored or undetected in less impoverished areas.

    A testing time ahead
    So while we live in an imperfect world, we need to consider biases in the data and structural barriers in society, and take action to address these. This isn’t easy – as illustrated by Ofqual’s algorithm for allocating A-level grades (high-school final exams) in the UK in 2020, following exam cancellation due to the COVID-19 pandemic. As discussed in our recent article When the algorithm fails to make the grade, it appears that a sincere effort was made to produce a fair process, which did tick many boxes. However, it fell short in significant areas and the backlash eventually led to the algorithm-awarded grades being scrapped.

    ‘Professor Lokke Moerel, of Tilburg University, the Netherlands, likened AI to the first cars … ‘

    Other concerns that go hand in hand with fairness

    Fairness tends to dominate discussions about ethical AI, but the other aspects of an ethical process are also important. For example, inappropriate use of data is a significant breach of trust and may possibly breach regulations as well.

    Transparency is critical because it allows you to understand why your models make certain predictions. Not only is this important for sense-checking of results but it’s also important when looking at fairness at an individual level. It can help you identify the source of unexpected results. In a wider sense, it also includes being very clear about what the algorithm can and can’t do and when algorithm results should be supplemented by human judgment.

    Finally, accountability is important to ensure a pathway is set out for decisions to be challenged and changed where appropriate. Dystopic fictional futures in which algorithms make all decisions should belong in science fiction – keeping humans with real agency in the loop is important. The reality is different, however, and not confined to fiction – we already see numerous examples of ‘the algorithm says so’. For instance, earlier this year, an African American man in Michigan was wrongfully arrested and held in a detention centre for nearly 30 hours after facial recognition technology incorrectly identified him as a suspect in a shoplifting case.

    We’ve spent ages coming up with the fairest process we could think of, so we don’t have to worry about it again. Right?

    Wrong. No matter how hard you try, there will be some undetected bias in the model, or some unanticipated unfairness or unintended harms. You’ll need to closely monitor the outcomes of your system and identify ways in which it can be improved. This could be anything from minor changes to going back to the drawing board.

    In a presentation to the 2020 European Actuarial Academy conference on data science and data ethics, Professor Lokke Moerel, of Tilburg University, the Netherlands, likened AI to the first cars, which didn’t have brakes or other safety features. It was only after people started driving them for a while when the need for brakes was realised. As time went on, we iterated over more and more safety features. The same too with machine learning and big data – we need to be aware when we deploy solutions that there will be failings and shortcomings, and we must be prepared to regularly address these and improve processes and systems in the interests of all those in our society, particularly the disadvantaged.

    A systemic approach to regulating machine learning and artificial intelligence

    The first-car analogy extends further. Professor Moerel also noted that the infrastructure to support the first cars, such as traffic systems and the wide use of tarmac roads, was not present but developed over time. Likewise, machine learning infrastructure is also missing, specifically, regulating the use of machine learning to ensure it’s used in an ethical and beneficial way, rather than used by a small number for their advantage at the significant disadvantage of the majority. It’s important we all continue to have this conversation together, and take action at individual, organisational, governmental and global levels to bring about a future where AI is used to help not hinder.

  • The highs, lows and future of ethical machine learning

    The world’s most valuable resource is no longer oil, but data – The Economist

    Big data is the new oil. Just as oil enabled us to progress our civilisation, big data provides many opportunities for advancements and insights, primarily through machine learning and artificial intelligence. In the first of a two-part series, we explore the ups and downs of a booming industry and why ethics are increasingly centre stage.

    What is machine learning?

    Machine Learning typically refers to algorithms and statistical models that enable computers to draw inferences from patterns in data without having each step explicitly encoded by a human operator. Some of these algorithms may also self-adapt over time as new data is presented to the system. These systems may then be applied to tasks normally perceived to require human intelligence, such as visual perception, speech recognition, decision-making, and translation between languages.

    Typically, machine learning requires large amounts of data to achieve accurate results. Developments in computing power, storage and the increased digitalisation of the world have created the conditions to facilitate this requirement and allow for the data-based revolution to take place.

    What are the benefits of machine learning?

    Machine learning delivers many opportunities …

    Insights
    It can help us find new relationships in data. For example:

    • Finding similarities in bacterial and viral DNA sequences can help determine the evolutionary relationships between different strains. For disease-causing pathogens, this is an important tool for tracking outbreaks and to develop treatments.
    • In the same general field, scientists believe a recent development could transform computational biology. DeepMind’s AlphaFold, which uses deep learning, has vastly improved the ability of computers to accurately predict the 3D shape of proteins, comprehensively outperforming the prior state-of-the-art algorithms in a recent global competition. Knowing the shape of proteins is important in many research areas, including genetic diseases and drug discovery.

    Efficiency
    It can lead to greater efficiencies in processes. Natural Language Processing (NLP) was used to mine more than 200,000 research articles for findings that might be relevant to the treatment of COVID-19.

    Service
    It can improve some aspects of service delivery:

    • NLP tools like Google Translate are making communication easier across the language divide, opening numerous opportunities – personal, business and societal
    • Recommender algorithms like those used by streaming platforms can guide us to content that is of interest to us.

    Decision-making
    It can combine a lot of data into a more digestible form to assist with decision-making:

    • Medical diagnoses are crucial to get right. Machine learning systems can help to process a lot of data and/or X-rays to suggest possibilities and out-perform human experts. For example, a 2020 study reported in The Lancet medical journal found that an ML algorithm showed better diagnostic performance in breast cancer detection compared with radiologists.
    • Organisations (both government, NGO and corporate) can similarly use machine learning tools to inform their decision-making.

    The dark side of machine learning

    The data and machine learning revolution also has significant downsides.

    Misuse of data
    This is the use of data without permission. This is well exemplified by the Cambridge Analytica (CA) scandal where, among other things, CA harvested the personal data of up to 87 million Facebook users through an app called This is Your Digital Life. Users gave the app permission to acquire their data, which in turn gave the app access to their network of Facebook friends. Only about 270,000 users actually used the app, meaning the vast majority of people whose data was taken by CA had not given permission for their data to be used.

    Many journalists and experts consider Facebook is shaking the foundations of democracy

    However, the use of data is troublesome even when internet users ‘consent’ to share their data. How many of us actually read the small print outlining which permissions are granted? It’s likely that consent is frequently given without a true understanding of what exactly is being granted. And even if an individual denies permission, the CA case demonstrates that our social network contacts can unwittingly release our data without our explicit permission.

    Creation of echo chambers
    Platforms like Google and Facebook want us to keep coming back. To ensure this, they show us content they believe we are interested in, rather than a balanced view of whatever issue we are researching, be it climate change or politics, for example.

    The polarised political scene in the United States, for example, has highlighted the issue of ethical responsibility for social media giants, especially in considering the broader implications of showing people content that aligns only with a user’s opinions.

    Similarly, climate change denial and anti-vaccination campaigns owe no small part to recommender algorithms (such as those used by Google, YouTube and Facebook), sending people down a rabbit hole of anti-science rhetoric. If you want a good illustration of this, watch a YouTube video on something like the Flat Earth conspiracy theory and note the subsequent recommendations you receive.

    Externalities/unintended consequences
    In economics, an externality is a cost or benefit caused by a producer that is not financially incurred or received by that producer. In the world of machine learning, this could also be rephrased as unintended consequences, a kind of digital or cyber pollution.

    It’s unlikely Mark Zuckerberg set out to shake the foundations of democracy when he set up Facebook, and yet many journalists and experts consider Facebook does just that, both through the creation of echo chambers and facilitating the spread of misinformation. Even if corrected or removed afterwards, the misinformation lingers. As the Anglo-Irish satirist Jonathan Swift wrote in 1710, “Falsehood flies, and the truth comes limping after it.” Recent reporting by the New York Times suggests a conflict within Facebook between maximising user engagement and platform growth, and reducing the spread of false or incendiary information.

    In her book Weapons of Math Destruction, Cathy O’Neill argues that US university rankings introduced in the 1980s by a single news magazine created a feedback mechanism with self-reinforcing rankings – that is, lower ranked universities would be avoided by top students and academics, funding would reduce, and the ranking would fall even further.

    She also makes several other arguments, notably that the omission of college fees from the metrics used to assess universities is one contributor to the high cost of education at prestigious US universities. Dramatically altering the third-level education environment was not the objective of the news magazine, rather it was focused on ensuring its own survival and selling copies.

    So what can we do?

    There’s an obvious need for a societal response to these challenges. Regulations such as the EU’s General Data Protection Regulation (GDPR) are a small step in the right direction. A set of GDPR provisions are targeted towards AI, restricting automated decision-making (ADM) and profiling when there may be ‘legal’ or ‘similarly significant’ effects on individuals (for example, the right to vote, exercise contractual rights, or effects that influence an individual’s circumstances, behaviour or choices).

    The ePrivacy Directive and GDPR mandate that users must be able to deny access to cookies. However, it’s much easier for EU residents to click the Accept All Cookies button once, than have to go through the step of rejecting all cookies and saving this setting each time they visit the website. And that’s assuming the website is available – some content is not viewable within Europe to those who deny cookies.

    Clearly more needs to be done. While the systemic nature of the risks of machine learning and big data demand a system-wide approach to its regulation, it’s also important that individual users and developers of machine learning tools think about their own planned use and ensure that it’s ethical.

    Experts suggest Just War Theory can be applied to AI to achieve greater fairness

    What is Just War Theory and what can it teach us?

    On the back of the growing concern over the use of machine learning and the broader field of artificial intelligence (AI), Professor Seth Lazar, of the School of Philosophy at the Australian National University, and project leader of the interdisciplinary research project  Humanising Machine Intelligence, suggests using Just War Theory as a philosophical framework. Just War Theory is studied by theologians, ethicists, and policy and military leaders. It aims to set out conditions that must be met for a war to be considered just. There are two components:

    • Jus ad bellum: the right to go to war. In other words, can this war be justified? For example, a war to remove a genocidal dictator might be considered justified but a war to steal natural resources of a neighbouring country might not. Proportionality is also an important consideration here – the anticipated benefits must be proportional to the expected harms of the war.
    • Jus in bello: this considers how combatants should wage war – what acts are justified and what are not. For example, civilian targets would be prohibited, while prisoners of war should not be mistreated. Again, proportionality is important – the harm caused to civilians and civilian infrastructure must not be excessive relative to the expected military gain.

    International law, which contains some laws around war and military conduct inspired by Just War Theory, can be used to prosecute those accused of war crimes – for example, the Nuremberg Trials after World War II and the International Criminal Tribunal following the Balkan wars of the 1990s.

    Applying the past to the present
    Professor Lazar suggests asking similar questions of artificial intelligence:

    • Is it justified to use AI in the first place and in what circumstances? (jus ad bellum)
    • What is an acceptable way of using AI? (jus in bello)

    The second question is discussed a lot in machine learning and wider circles, where concepts of fairness, ethics and bias are regularly considered, but perhaps the first question is not addressed as often as it should be.

    Given the huge potential upsides and widespread use of machine learning and big data, a moratorium on its use is very unlikely to happen. Instead, as we grapple with the issues of being a society that is undeniably data driven, we should all ensure that any applications of it under our control are justified and fair.

    How can organisations – how can you – be more proactive about fairness?

    As business and government leaders look for ways to address issues of ethics and fairness with data and data technology, a good starting point when setting up (or reviewing) a system that uses machine learning is to consider if you should be using machine learning for this task in the first place. It’s a complex question, so answering the following may guide you to a decision:

    • What outcomes are you trying to achieve?
    • Are there unintended consequences (especially negative) of what you propose?
    • Are the potential benefits of the outcomes proportional to the potential harms of the process?

    The importance of diversity
    For many of these discussions, diversity is key – get a diverse set of stakeholders in the room, ideally including both those using and those who will be affected by the system, and have a robust conversation about all relevant issues.

    Part of this conversation should consider what you are currently doing. Ethics and fairness apply whether you use machine learning or not, so review the current state of play and whether your proposal improves this. Even if your proposal isn’t perfect (and it won’t be – we live in an imperfect world), it may be a sufficient improvement over the status quo to justify its use.

    The question of proportionality is critical here. Facial recognition software has many known problems, particularly for those with darker skin, but there may be some justification and acceptance for using it as part of a detective toolkit to find a mass murderer rather than a petty thief, and so long as there is appropriate human oversight.

    Be vigilant at every stage of the process
    If you conclude there is a justification for using machine learning, then you can move onto the second question – how can you use it in an ethical way? It’s important to note that you need to think of the system as a whole – from data collection to modelling to application. You can’t just focus on the machine learning component – a fair model means little if the way in which it’s used is unfair. Problems with a system can occur at any point in the pipeline, and not only at the machine learning stage.

    Next week in part two of our ethical machine learning series, we delve into what it means to be fair, the surprising ways bias creeps in and how to ensure dystopian sci-fi scenarios remain in the realm of fantasy.

  • Big little highs

    As general insurance undergoes transformation, it’s the large and small things that count, and players will need agile thinking to flourish.
    Taylor Fry’s Scott Duncan explains.

    Paradigm shifts are well underway in the general insurance industry, signalling a change from old-world thinking to new. To thrive in the new world, insurers must think both big and small. Big-picture items include understanding social changes, refreshing product offerings and ensuring agile thinking to capitalise on opportunities. Thinking small involves placing yourself in the customer’s shoes to build a better understanding of their lifestyle and requirements.

    Here’s our take on three areas undergoing the change from old world to new, and recent initiatives showing the way forward.

    Partnerships

    Old world: Partnering with organisations that share the same DNA, and will therefore complement your existing offerings. The old-world terminology used to describe the benefit of these relationships is ‘synergies’.

    New world: Building partnerships on a micro and macro level with organisations that think differently from you and will therefore challenge the way you do business.

    Launched in 2016 and backed by a $75 million investment, IAG’s Firemark Ventures is described as the ‘strategic investment group within IAG for start-ups and emerging growth businesses’. Firemark is concerned with exploring:

    • New and innovative sources of data
    • Anything that has potential to impact the insurance value chain
    • New business models and technologies that expand or redefine insurance needs.

    In other words, IAG aims to think like a start-up and change the way it does business.

    As general insurance undergoes transformation, players will need agile thinking to flourish

    The customer

    Old world: Primary focus is on the customer’s short term needs. Companies attempt to create additional value by offering discounts for multiple products and customer loyalty.

    New world: Developing a clear picture of the customer’s life stage, their lifestyle and needs. Reorienting the business to support a holistic view of the customer and aiming to interact with the customer on a regular basis.

    Suncorp allocated $142 million in FY18 to accelerate its marketplace strategy by creating a network of ‘brands, partners, solutions and channels’. The intention is to build a platform that encourages greater customer engagement and connection, and builds loyalty. To Suncorp, the value is clear: ‘Those [customers] who hold four products are nine times the value of those with just one product line.’

    New products and services

    Old world: ‘Squeezing’ customers into core products.

    New world: Flexibility, flexibility, flexibility – building on partnerships and developing greater understanding of the customer in order to offer appropriate products and respond to new ways of owning and using assets.

    Players are exploring opportunities to develop new products as risks to continued growth in traditional classes of business emerge. Examples include:

    • On-demand insurance. For example, Trov, in partnership with Suncorp, provides ‘on demand’ insurance for phones, laptops, tablets, wearables, headphones and photography gear.
    • Micro insurance in the sharing economy. Kevinsured.com offers cover for online interactions. Kevin uses blockchain and reviews the reputation of the buyer and seller in the transaction and presently, if approved, provides $100 of free cover.
    • Sharing economy. ‘Mobilise’ is a platform that allows businesses to hire out equipment they are not using. Mobilise launched in association with Aon, which will source cover for the equipment while on hire.
  • When the algorithm fails to make the grade

    In our latest article, the story of the UK algorithm to assign high school grades following exam cancellations teaches an important lesson for everyone building models where questions of individual fairness arise.

    There have been many consequences of the pandemic. While health and employment concerns are rightly prominent, education is another domain that has seen significant disruption. One recent story intersecting with modelling and analytics is the case of school grade assignment in the UK. With final year exams cancelled due to the pandemic, the Office of Qualifications and Examinations Regulation (Ofqual) was presented with the challenge of assigning student grades, including the A-level grades that determine eligibility for university entrance.

    Part of the challenge is that centre-assessed grades (grades issued by schools based on internal assessment) are always optimistic overall compared to actual exam grades, so the process required choosing the best way to move grades closer to historical patterns. An algorithm was created to produce predicted grades across the whole student cohort.

    However, when results were posted out there was student outrage at the perceived unfairness of people who received a lower grade than they expected. Pressure led to all governments across the UK backflipping and announcing that centre-assessed grades would be recognised instead of the algorithmic grades. While a win for many students who felt they deserved higher grades, it does raise significant further questions and represents a poke in the eye for those who stood by the robustness of the algorithmic grades.

    In many ways the Ofqual algorithm for adjusting grades ticked all the right boxes:

    • The process was thorough and transparent, with a detailed report released explaining the methodology, alternatives considered and a range of fairness measures to ensure particular subgroups were not discriminated against.
    • The process used available data well, incorporating a combination of teacher-assessed rankings, historical school performance and cohort-specific GCSE (roughly equivalent to our school certificate) performance to produce grade distributions. Such approaches are also used elsewhere. For example, in NSW HSC school assessment grades are moderated down using school rankings so they reflect a cohort’s exam performance.
    • The process gave some benefit of the doubt to students, allowing for some degree grade inflation. For courses and school cohorts where there were only a small number of students, more weight was given to centre-assessed grades.

    However, with the benefit of hindsight, it was clear that effort was not enough. The main factors contributing to the government backdown:

    • The stakes are very high. For many students, the difference between centre-assessed grades and modelled grades is the difference between their preferred university degree and an inferior option (or no university admission at all!). Students have a strong incentive to push back on the model.
    • Accuracy is good, but it was not great. While the report was careful to describe expected levels of accuracy (and choose methods that delivered relatively high accuracy), the reality is that a very large fraction of students got the ‘wrong’ grade, even if the overall distribution was fair. Variability across exams is substantial, and a very high level of accuracy would be required to neuter criticism and disappointment.
    • There were still some material fairness issues. Smaller courses are disproportionately taken by students at independent schools, and under the model these grades were less likely to be scaled back. Thus students attending independent schools were more likely to benefit from leniency provisions.
    • The model unilaterally assigned fail grades to students. The modelling included moving a substantial number of people from solid pass grades into the “U” grade (a strong fail grade, literally ‘ungraded’). There’s a natural ethical question whether it is fair to fail students who were not expected to fail according to their teachers, based on school rates of failure in prior years.
    • Perhaps most importantly, the approach failed to provide a sense of equality of opportunity. If you went to a school that rarely saw top grades historically, and your school cohort’s GCSE results were similarly unremarkable, there was virtually no way that you could achieve a top grade in the model. This does not sit well with students; the aspiration is that any student should be able to work hard and blitz their exams. Instead, students felt that they were effectively being locked into disadvantage, if they had attended a school with historically lower performance.

    Unsurprisingly, the final solution (adopting the centre-assessed grades) will create its own problems. Teacher ‘optimism bias’ is unlikely to be uniform across schools, so students with more realistic teacher grading will be relatively disadvantaged. Teacher grades may be subject to higher levels of gender or ethnic bias. The supply of university will not grow with the increased demand implied by higher grades; in some cases, this may be handled through deferrals which may have knock-on effects for availability for 2021 school finishers. And overall confidence in Ofqual has taken a substantial hit.

    I think there are some important lessons here for data analytics more generally. First, models cannot achieve the impossible; in this case, it is impossible to know which students would have achieved a higher or lower mark. In a high-stakes situation, such limitations can break the implementation of a model. Second, it raises the point that something that appears ‘fair’ in aggregate can look very unfair at the individual level.

    In situations where individual-level predictions have a significant impact, we should spend time understanding how results will look at that granular level, and who the potential ‘losers’ of a model are. Finally, an algorithm will often become an easy target. As we’ve also seen in COMPASS and robodebt coverage, a faceless decision-making tool carries a high burden of proof to establish its credibility; this requirement applies from initial model design through to results and communication. Appropriate use of modelling is something we will need to continue to strive for in our work.

    #InTheNews – “England exams row timeline: was Ofqual warned of algorithm bias?” from @guardian https://t.co/MjCKgyYc9V#NAPCE #pastoralcare #schools #education #teachers #exams #childwelfare #studentwelfare #covid19 #gcses #alevels pic.twitter.com/ruL5QUaBrs

    — NAPCE (@NAPCE1) August 21, 2020

    UK ditches exam results generated by biased algorithm after student protests https://t.co/ZQtWT1iqJe pic.twitter.com/G6RAldar59

    — The Verge (@verge) August 17, 2020

    As first published by Actuaries Digital, 24 September 2020

  • New Zealand general insurance 2020 update: news, views and trends

    How is the New Zealand general insurance market faring in 2020, and what are its biggest challenges going forward? Using the latest data and our market insight, we shed light on the New Zealand general insurance landscape, covering profitability, COVID-19, regulatory issues and more.

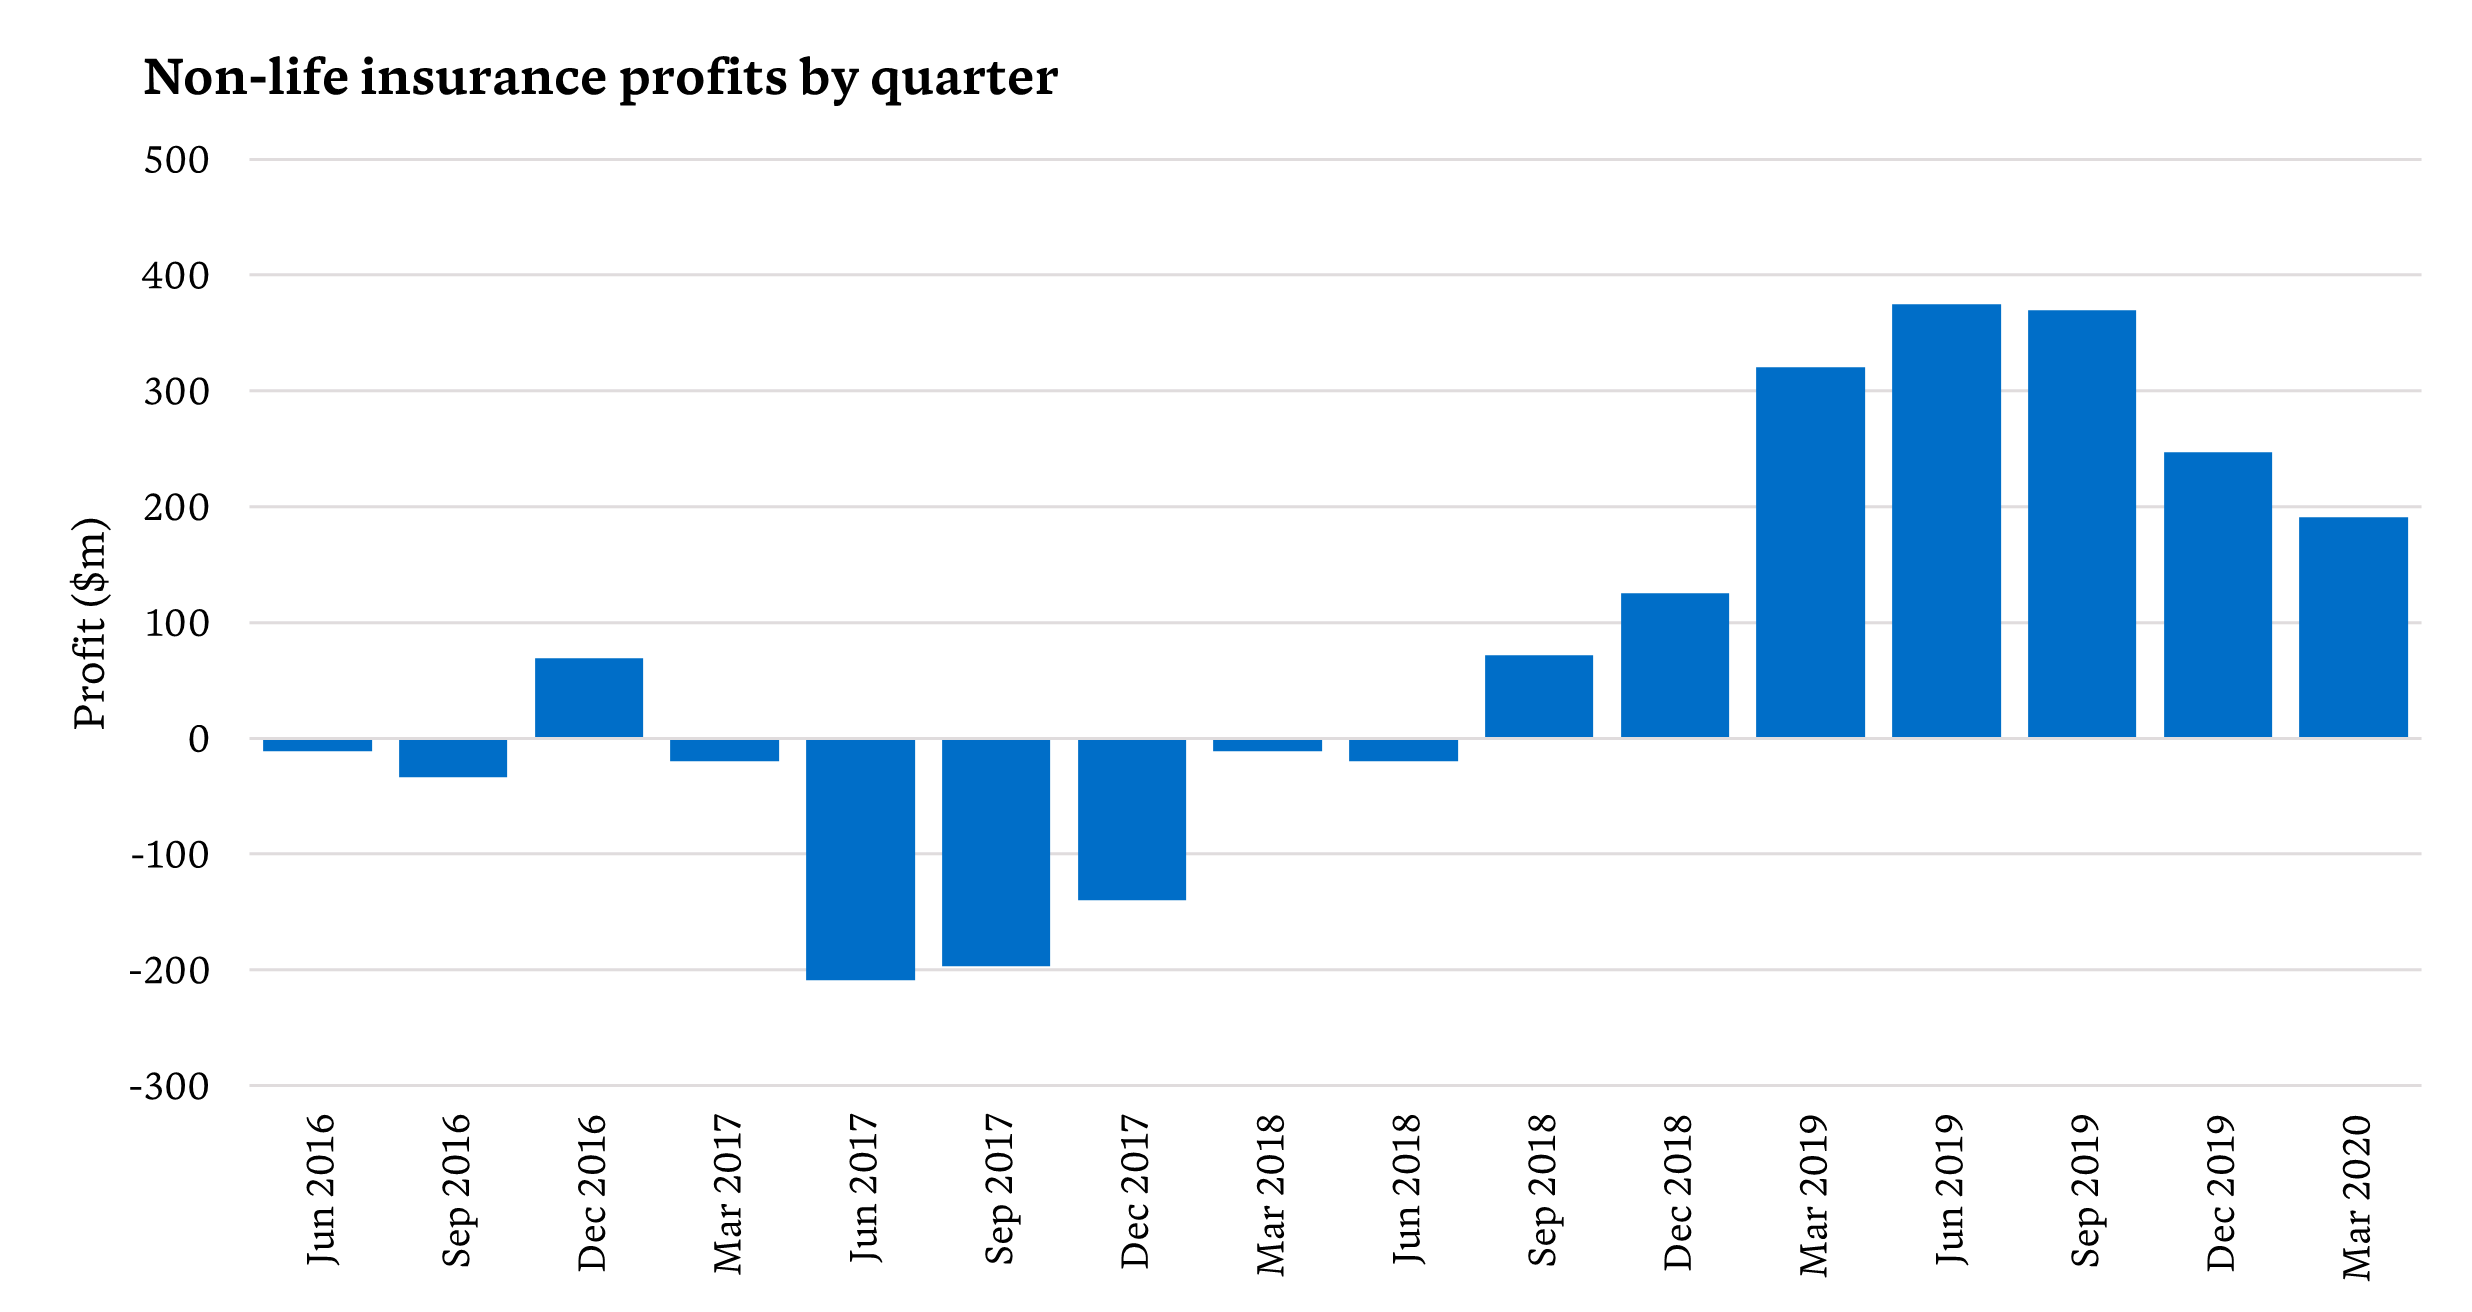
    Overall profitability strong, driven by few weather-related events

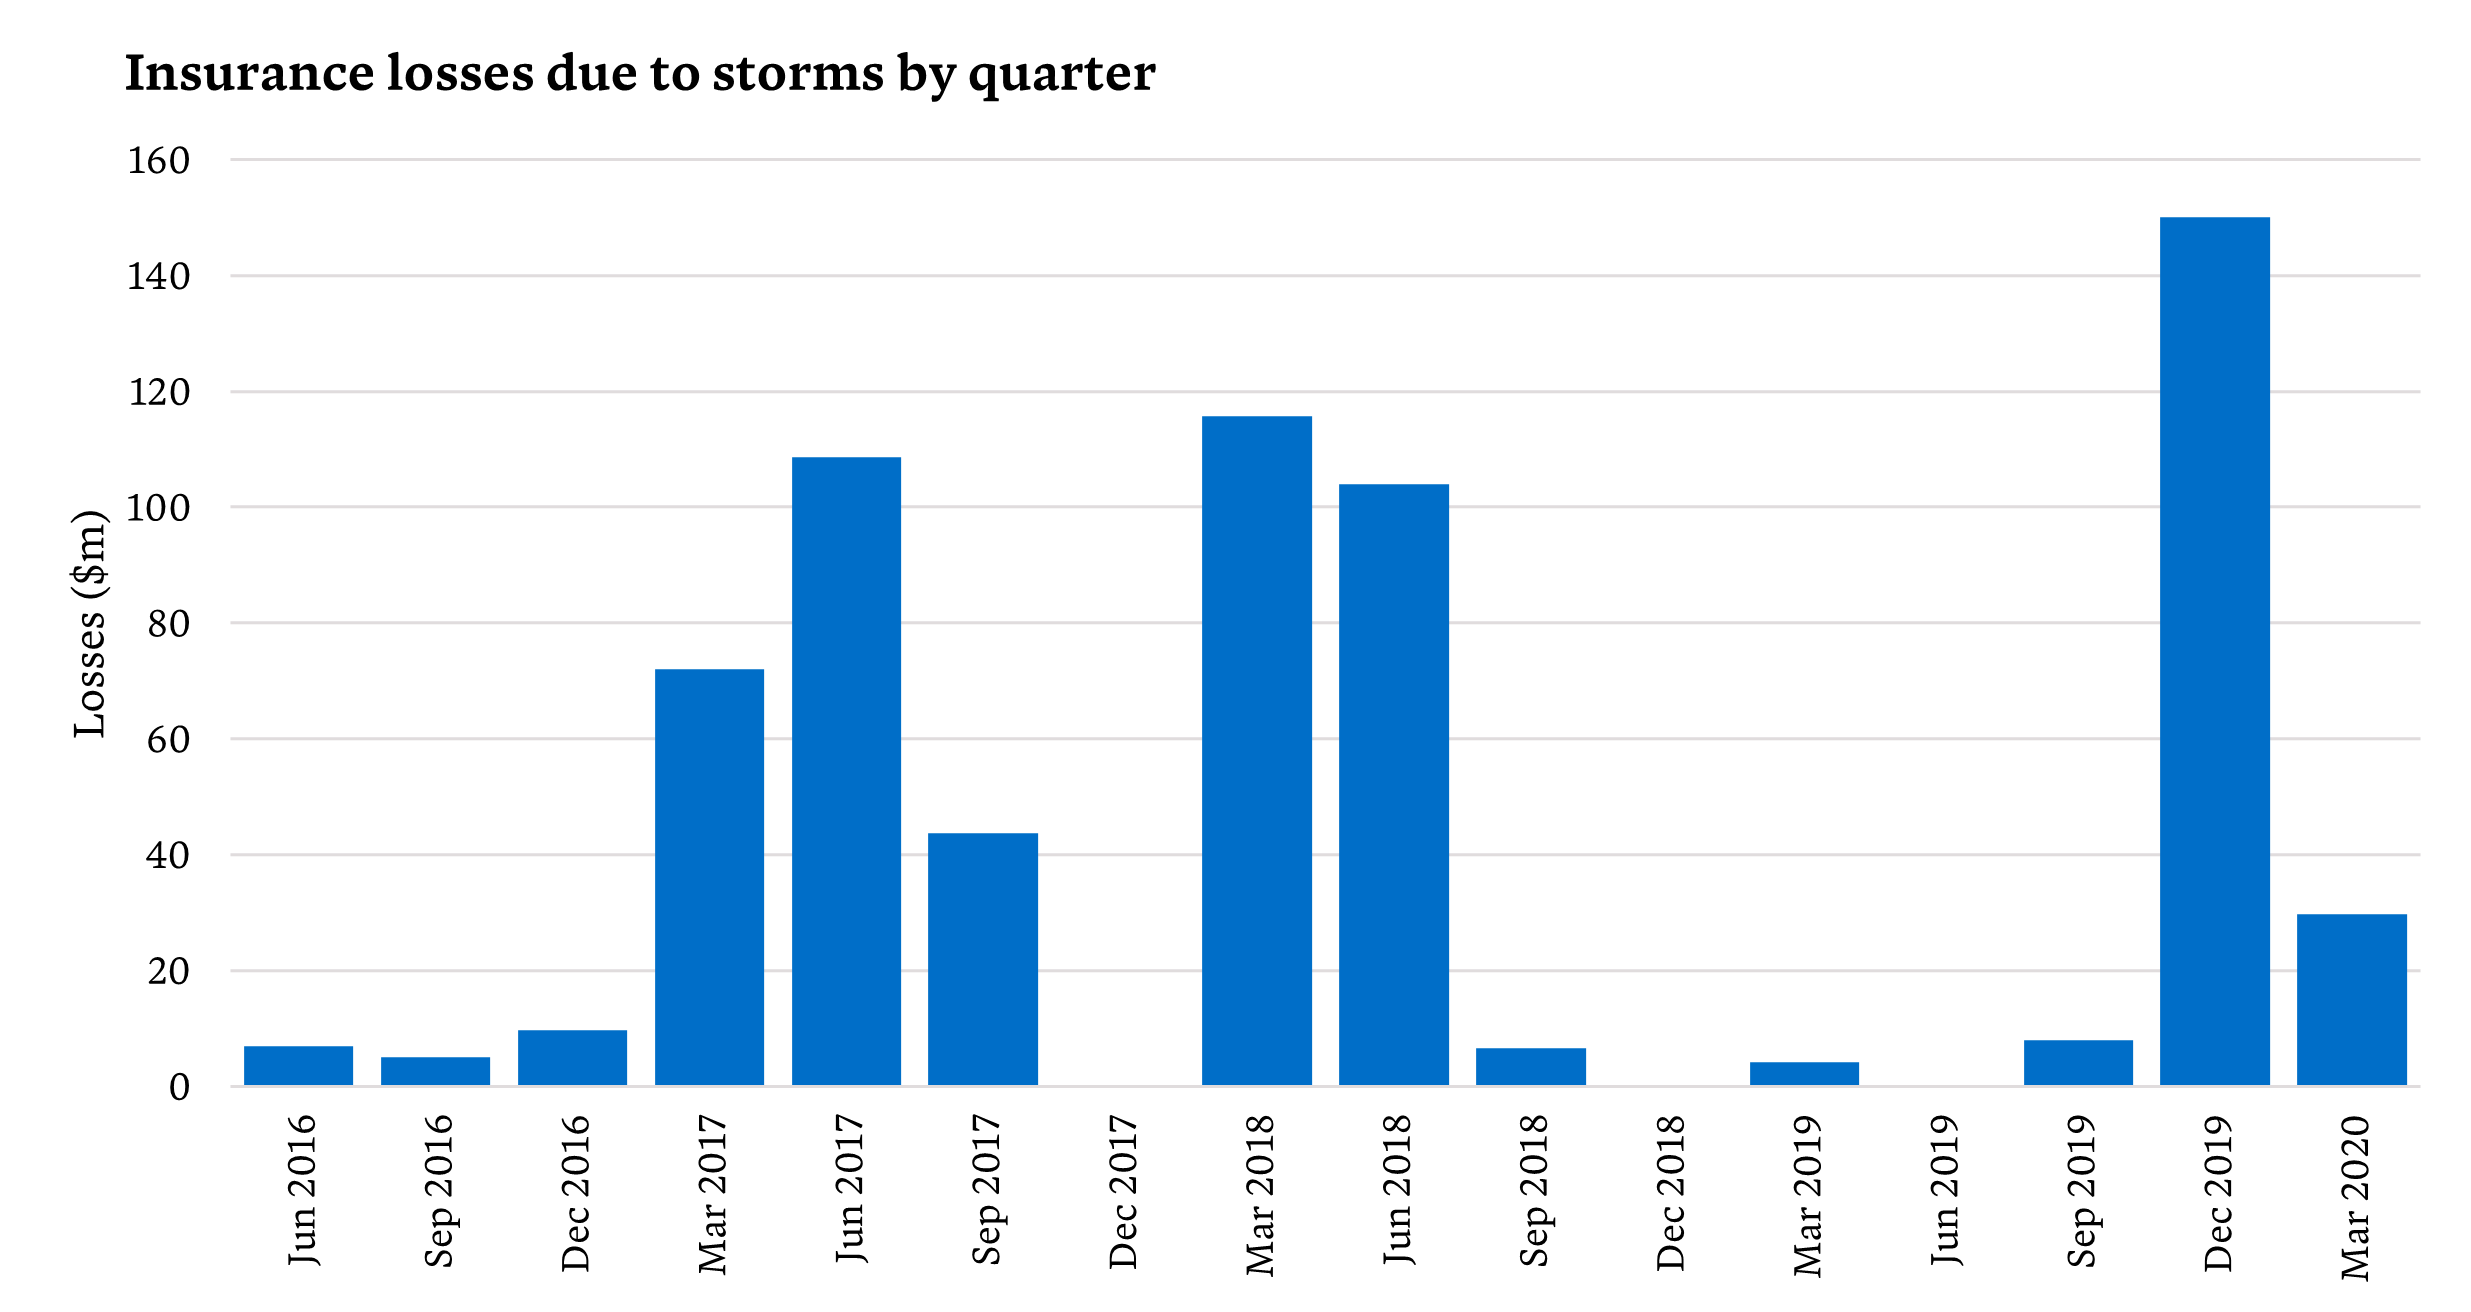
    Despite the uncertainty and global challenges of the ‘new normal’ brought on by the pandemic, general insurers in New Zealand have enjoyed a period of profitability over the past calendar year. This profitability – shown in the figure below – has been heavily influenced by relatively few weather-related large events between July 2018 and October 2019.

    Source: RBNZ Quarterly Insurance Financial Performance

    The run of benign weather was broken by the Timaru hailstorm in November 2019, which resulted in total losses of more than $130m 1. In contrast to most New Zealand storm events, where typically property classes are most impacted, more than half of the costs of the Timaru hailstorm have been for motor claims.

    Source: ICNZ cost of natural disasters

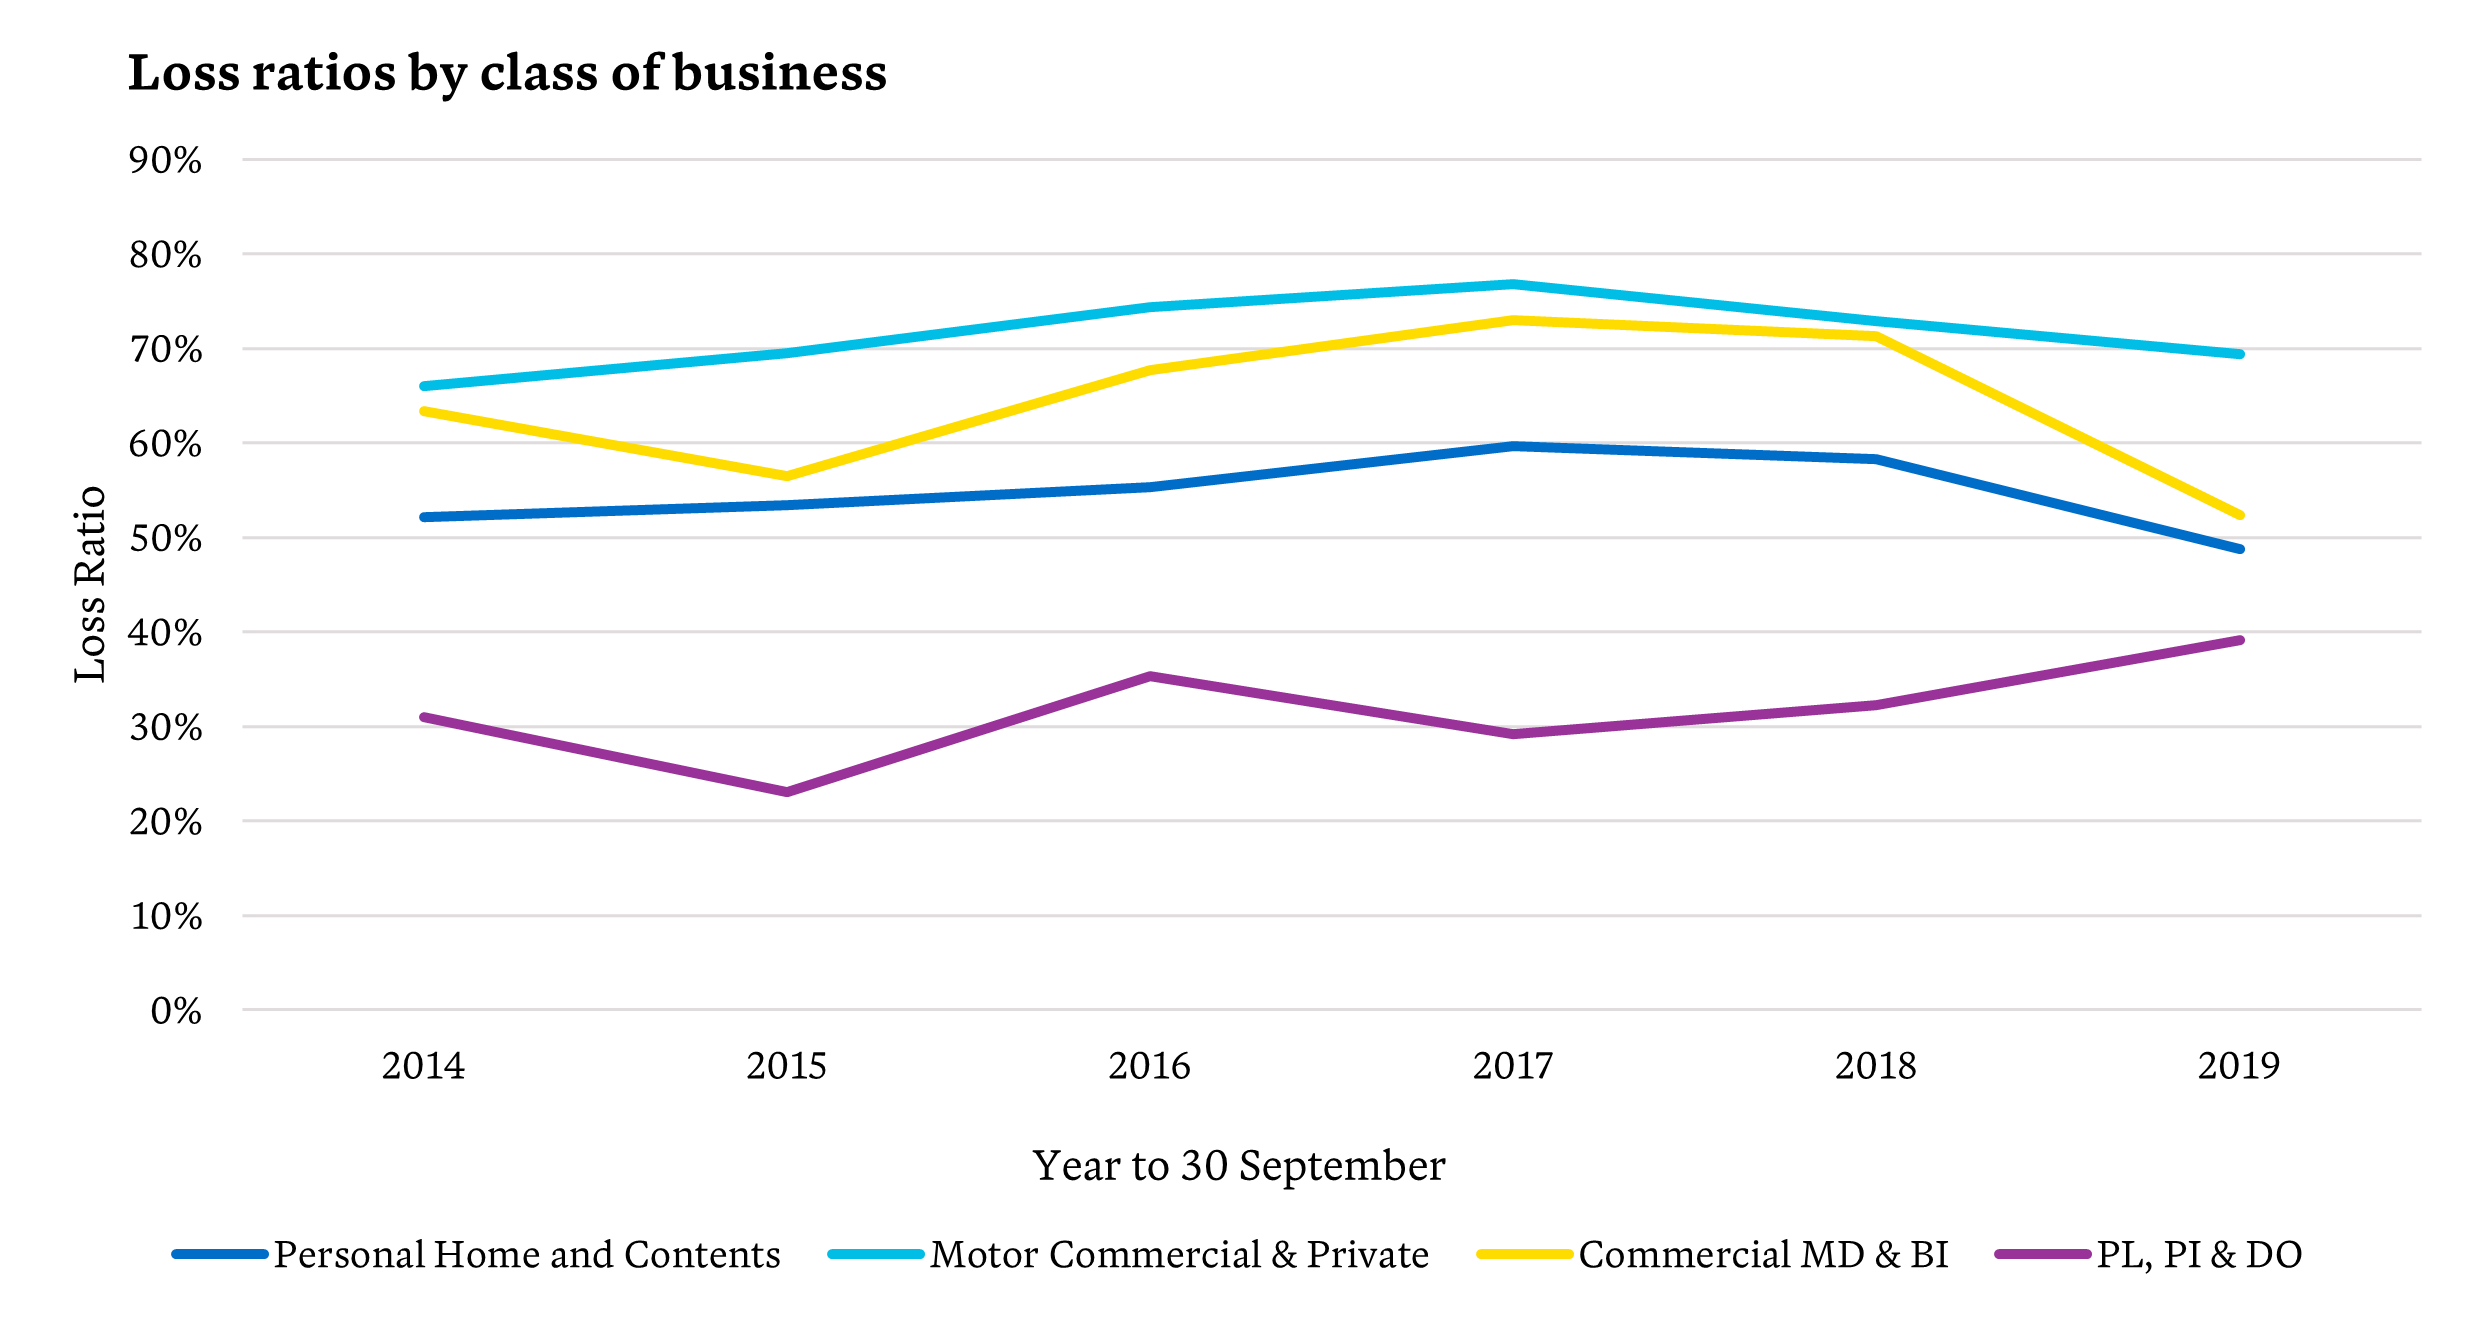
    In 2019, property risks for personal lines and commercial lines classes of business in the New Zealand general insurance market had their lowest loss ratios in the past five years2, predominantly due to the lack of large weather events over that period.

    Source: ICNZ Market Data

    Reinsurance woes mean bigger costs for customers

    The favourable claims experience in 2019 resulted in a flattening of premium rates for the personal lines property classes. Annual inflation for home insurance for the year to 30 June 2020 was 0.4%, following  three years of increases greater than 5%. Premiums for contents insurance have however continued to increase, although average premiums are generally lower for contents compared to home, due to lower levels of sums insured.

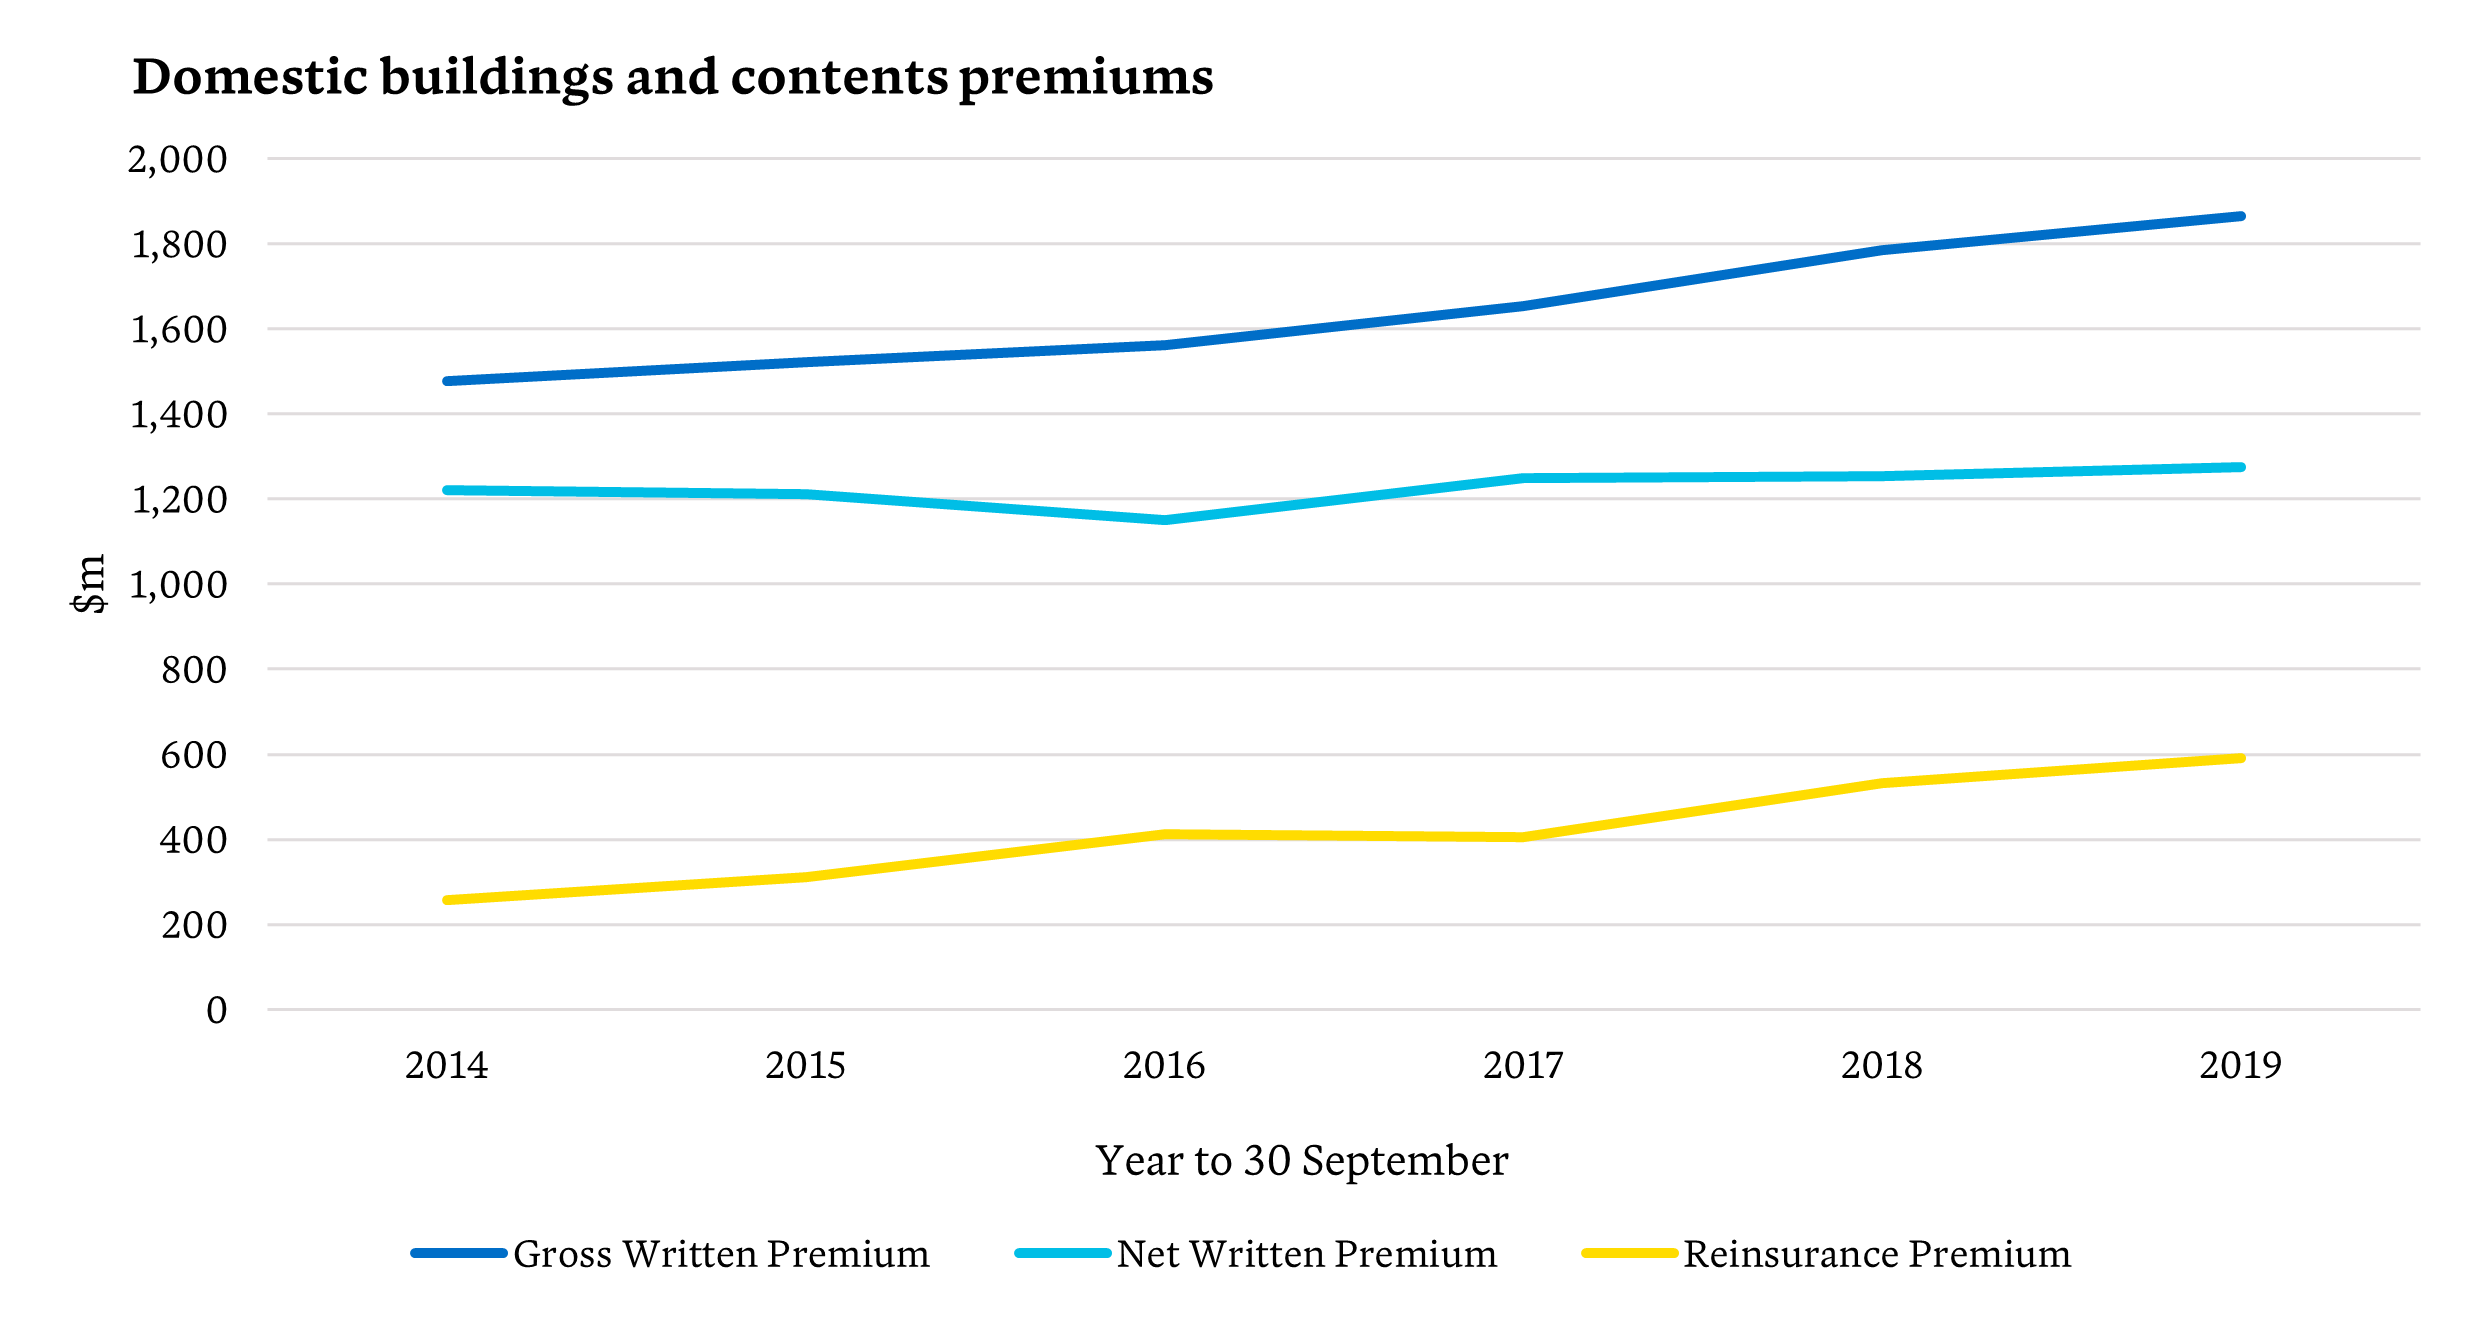
    The increase in premiums for home and contents over the past five years has mainly been due to increases in reinsurance costs. The figure below shows gross premiums, which are the costs that customers pay, have increased by an average of 4.8% per annum over the past five years. Net premiums, which are the costs excluding reinsurance, have increased by only 0.9% over the same period.

    Source: ICNZ Market Data

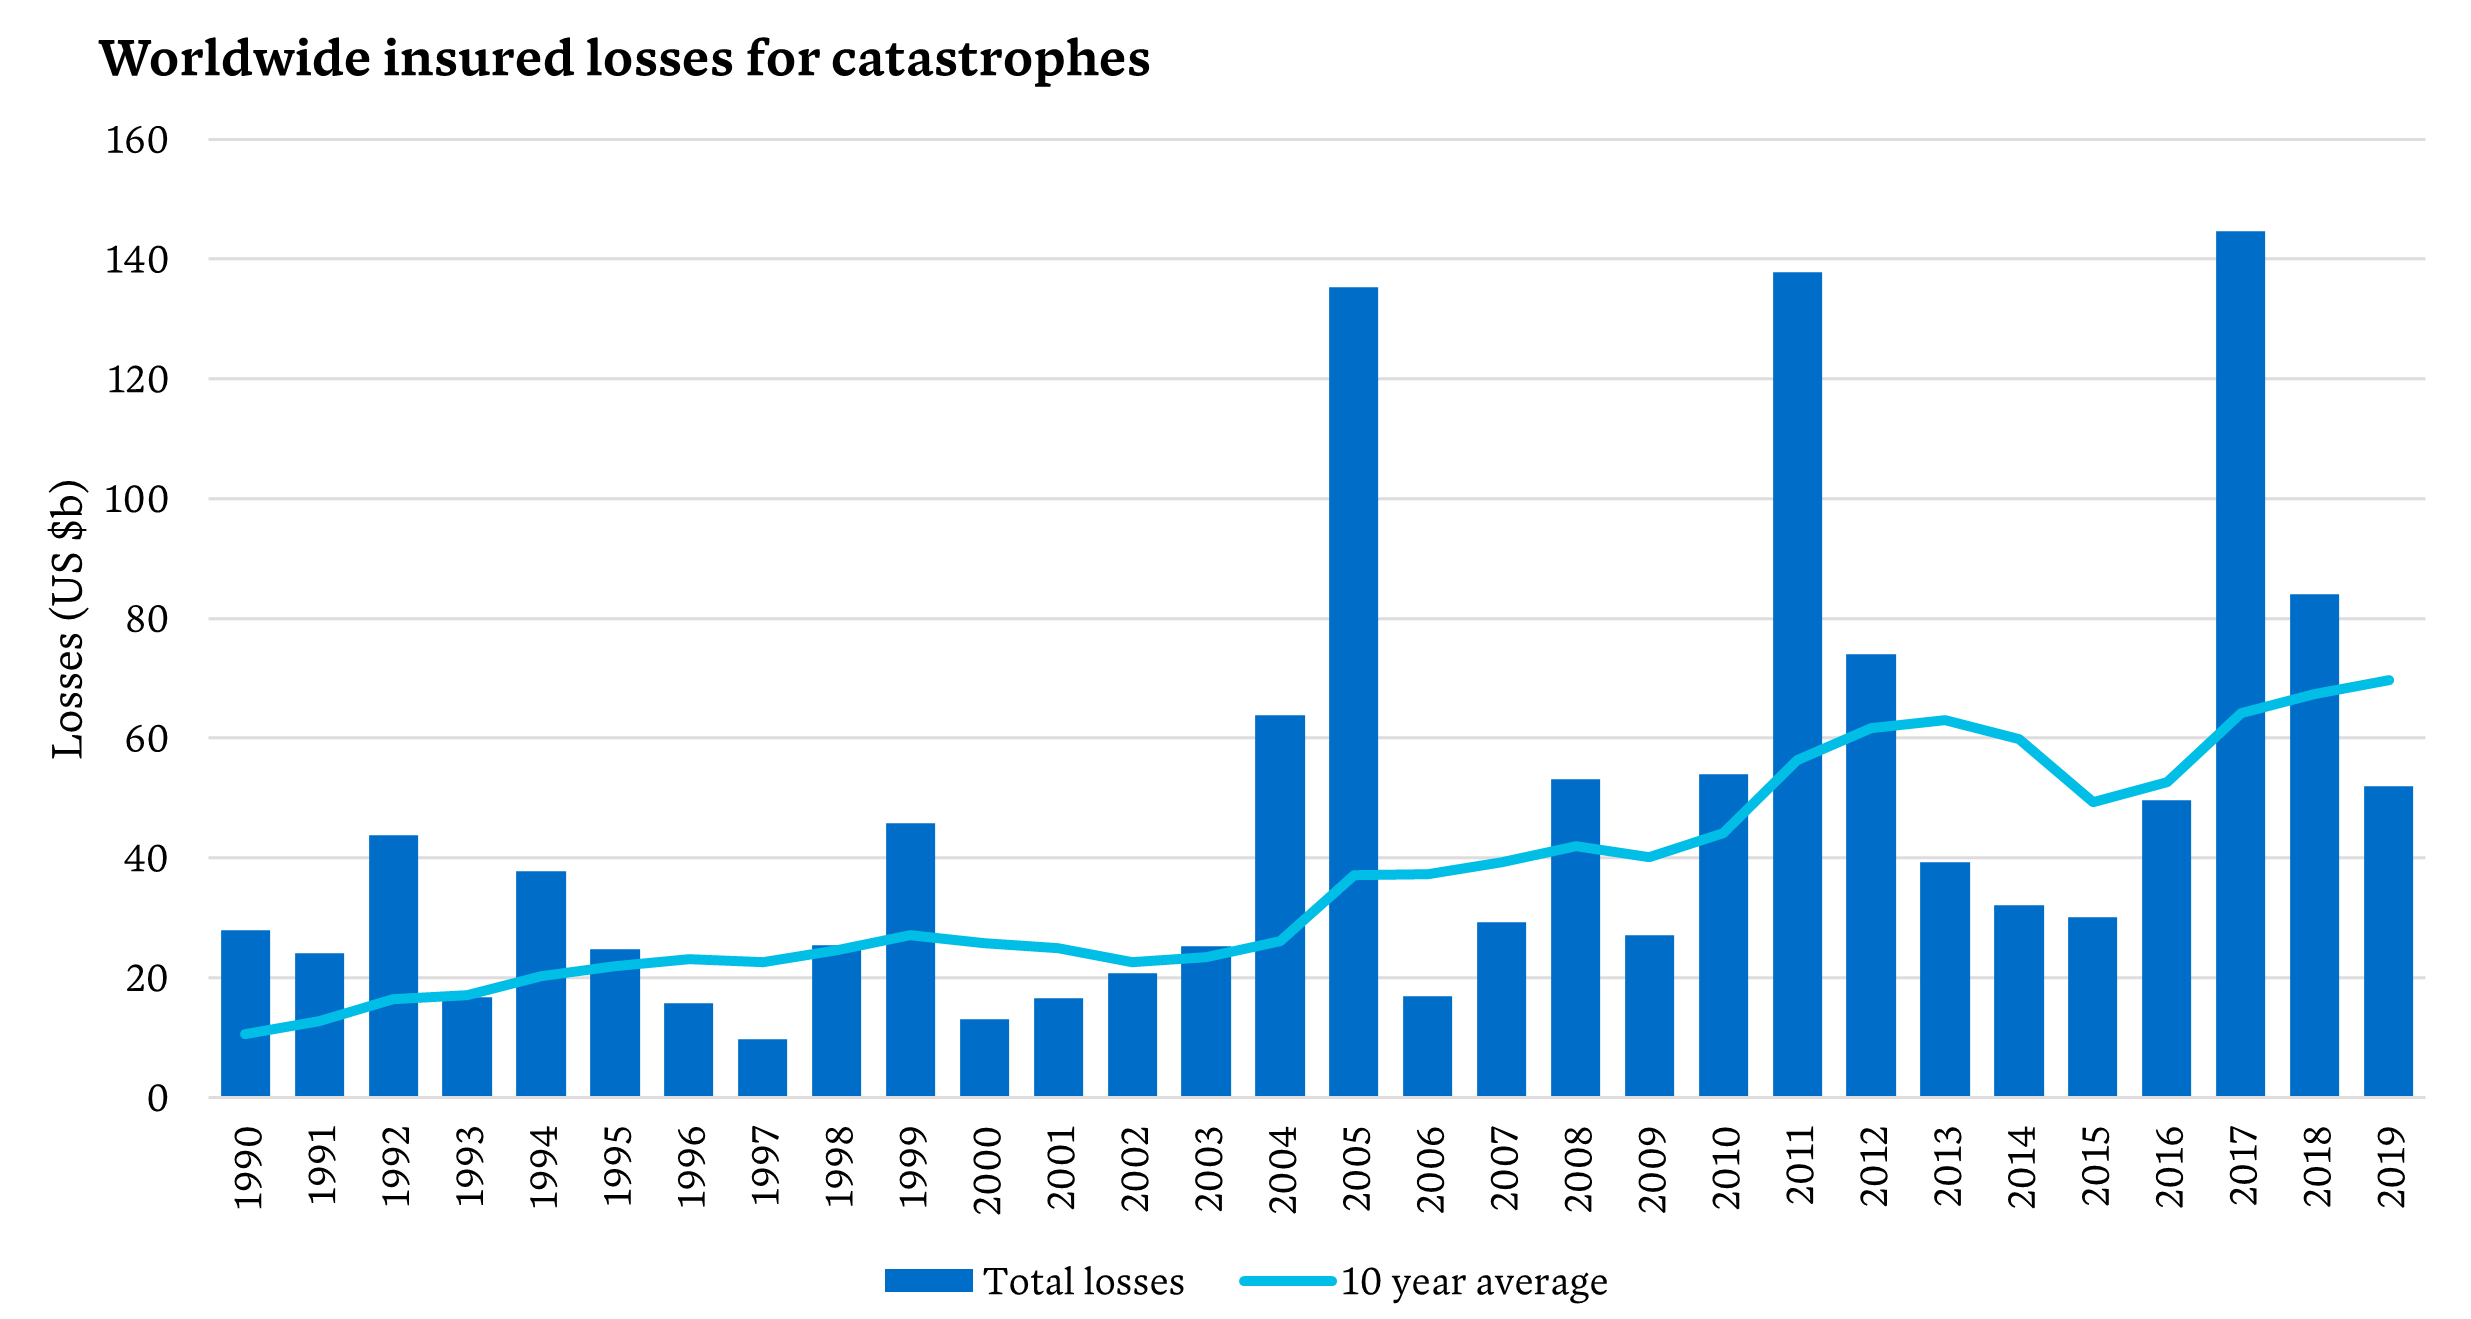
    The premiums New Zealand homeowners pay are strongly influenced by the global reinsurance market, and globally, reinsurance losses have been increasing as shown in the figure below. This is due to a combination of increases in the number and severity of natural disasters, and growth in the size of the market, as emerging markets seek reinsurance cover. In Australia, the bushfires of early 2020 are expected to result in the Australian market having its first underwriting loss since 20113.

    Source: Swiss Re – Sigma explorer

    Global reinsurers hit hard by the pandemic

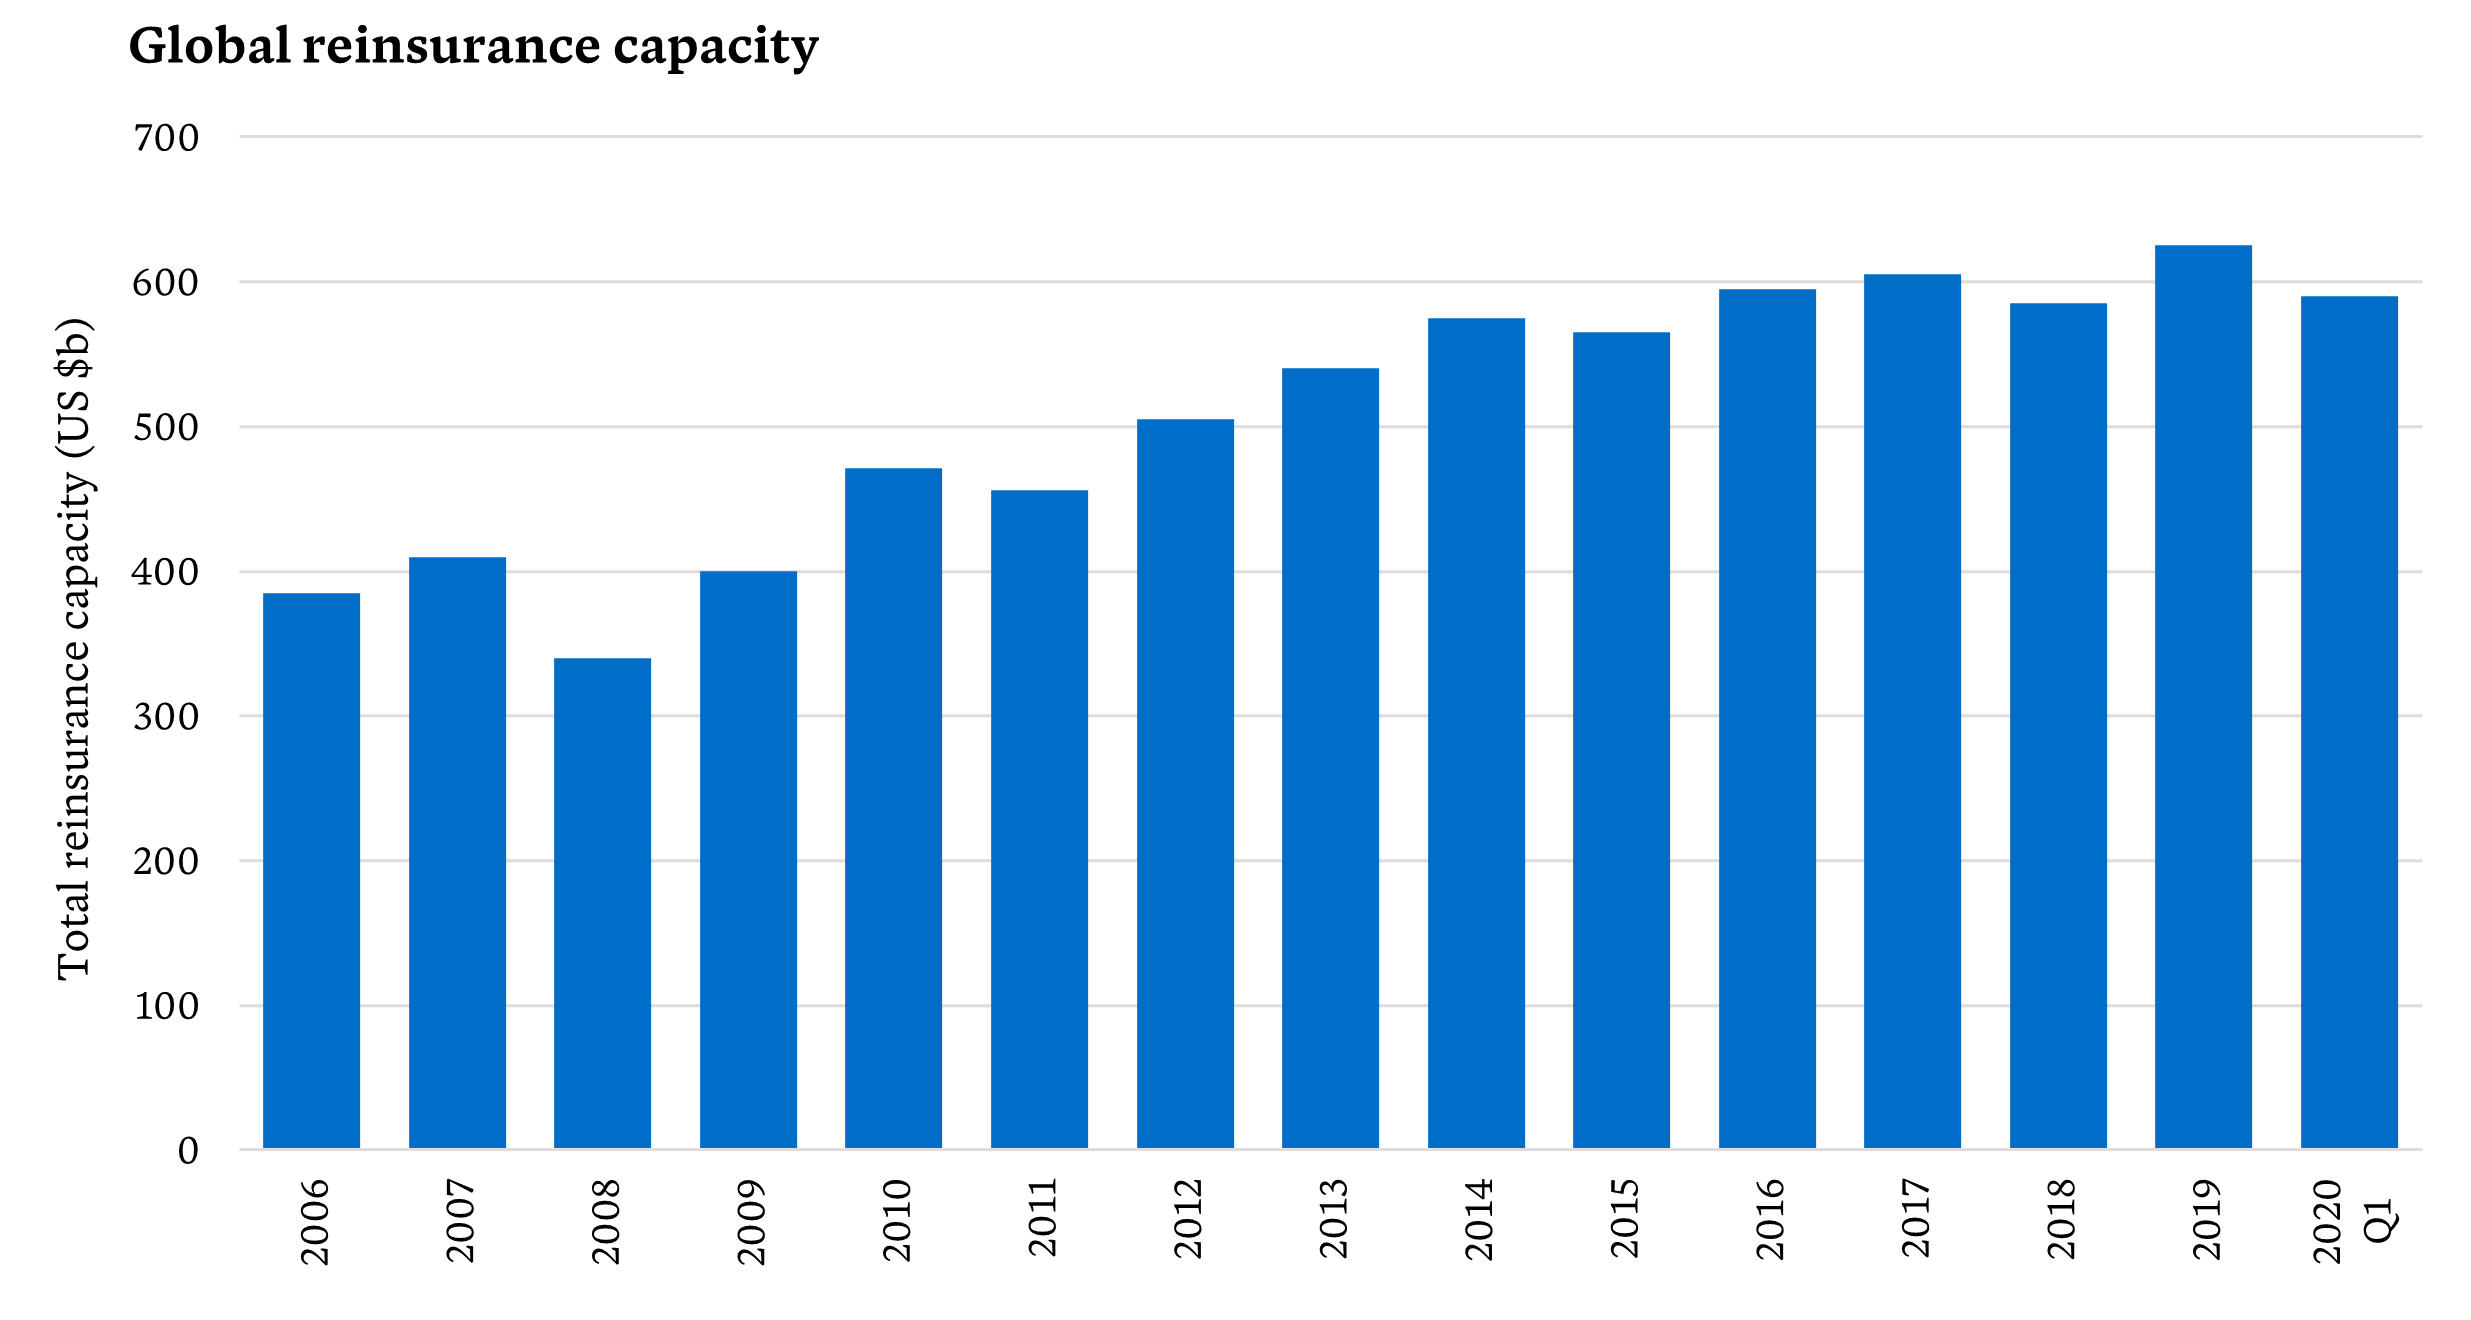
    Reinsurance rates are also impacted by the capacity of the global reinsurance market, that is, the amount of capital held by reinsurers that enables them to write reinsurance business. Between 2008 and 2017 reinsurance capacity was increasing. This increase in capacity helped limit the size of reinsurance premium increases.

    Reinsurance capacity has been stable since 2017, but early indications are that capacity has reduced in 2020 as the impact of COVID-19 hits global reinsurers in the form of increased losses, weakening balance sheets from reductions in asset values and reduced investment returns from lower interest rates. Swiss Re recently announced it expects reinsurance premiums to increase for the 2021 year4. We expect New Zealand property risks to continue to increase as reinsurance costs increase in the New Zealand general insurance market.

    Source: Aon reinsurance market outlook June/July 2020

    COVID-19 creates uncertainty for insurers

    The COVID-19 pandemic has already had a large impact on the entire New Zealand economy, and the way companies operate. The government-imposed lockdown during April and May meant insurers had to move quickly to remote working. The lockdown also resulted in a reduction in claims for motor insurance. In response, three insurers announced they would be partially refunding premiums to motor customers due to the reduced level of claims during the lockdown5.

    In the longer term, the economic impacts of COVID-19 are uncertain. The recent outbreak in Auckland has shown strong border controls will need to remain in place for the foreseeable future. With tourism playing a large part in the New Zealand economy, the longer these restrictions remain in place, the larger the financial impact on the country. The government has so far been proactive in providing support to New Zealand businesses, which has limited the impact on key economic trends, such as unemployment and GDP, but it’s likely more financial pain lies ahead.

    Unsurprisingly, COVID-19 has also created uncertainty for New Zealand general insurers. From a claims perspective, the impact will vary between classes of business. For example:

    • Traffic volumes tend to reduce during economic downturns
    • An increase in the number of people working from home may result in lower numbers of contents claims due to theft
    • Economic downturns can often result in an increase in fraudulent claims, which may result in an increase in claim frequency for personal contents and commercial property claims
    • Claims under credit insurance policies will also increase as unemployment starts to increase, although this is a relatively small class of business in the New Zealand market.

    Low premium volume: a recession reality

    The greater impact for New Zealand general insurers will be on claims volumes. Already all major insurers have introduced hardship measures to support customers. Suncorp announced $30m-worth of customer support in its year-end results, although more than half of this relates to the AA Insurance’s motor premium refunds. A recession will see a reduction in premiums as customers in financial hardship look to reduce their costs. This is likely to hit the personal lines and commercial SME classes the hardest.

    The other component insurers will need to monitor is how the economic crisis affects asset values and investment returns. Falling interest rates will reduce investment returns, although this will be offset by increasing values for fixed-interest assets. Most New Zealand insurers have quite short-tailed liabilities and so are less affected by investment returns. Even so, it’s still important for insurers to monitor their assets as well as their liabilities and consider how their values will respond in various economic scenarios.

    Climate change impacts should still be front of mind

    While COVID-19 has been the focus for most insurers over the past six months, it hasn’t reduced the impact of longer-term risks. In late 2019, the annual General Insurance Barometer, Taylor Fry’s joint publication with JP Morgan that surveys Australian general insurers6, identified climate change, with its associated natural perils, and regulation as the two main issues for insurers. The ongoing and far-reaching implications of climate change for insurers remain, despite being overshadowed by COVID-19 over the last six months.

    These issues will be no different for New Zealand insurers, as climate change effects will have an unfortunate synergy7. Climate change is expected to increase the frequency of severe meteorological events, such as floods, landslides, strong winds and hail. The higher temperatures and rainfalls arising from climate change will also shorten the lifespan of many buildings. The combination of these effects will result in higher insurance losses in the future. Independent analysis of the effect of climate change on residential property damage estimates insurance losses of between 7% and 8% between 2020 and 2040, and an increase of between 9% and 25% from 2080 to 21008.

    Insurers in the New Zealand general insurance market will need to watch out for the emergence of weather-related risks that have not historically been a major concern. The summer drought in Auckland and Northland is potentially a warning sign that risks such as bushfires may increase in New Zealand if we start to see significant changes in regional climates. Over the past four years, we have seen property losses due to summer bushfires in the Port Hills (2017) and Tasman district (2019). While insurance losses for these events have been smaller than other weather-related events, a bushfire in a more densely populated region (such as the Waitakere Ranges) could result in higher losses.

    Regulatory developments

    On the regulatory front, insurers have plenty of activity to keep a close eye on:

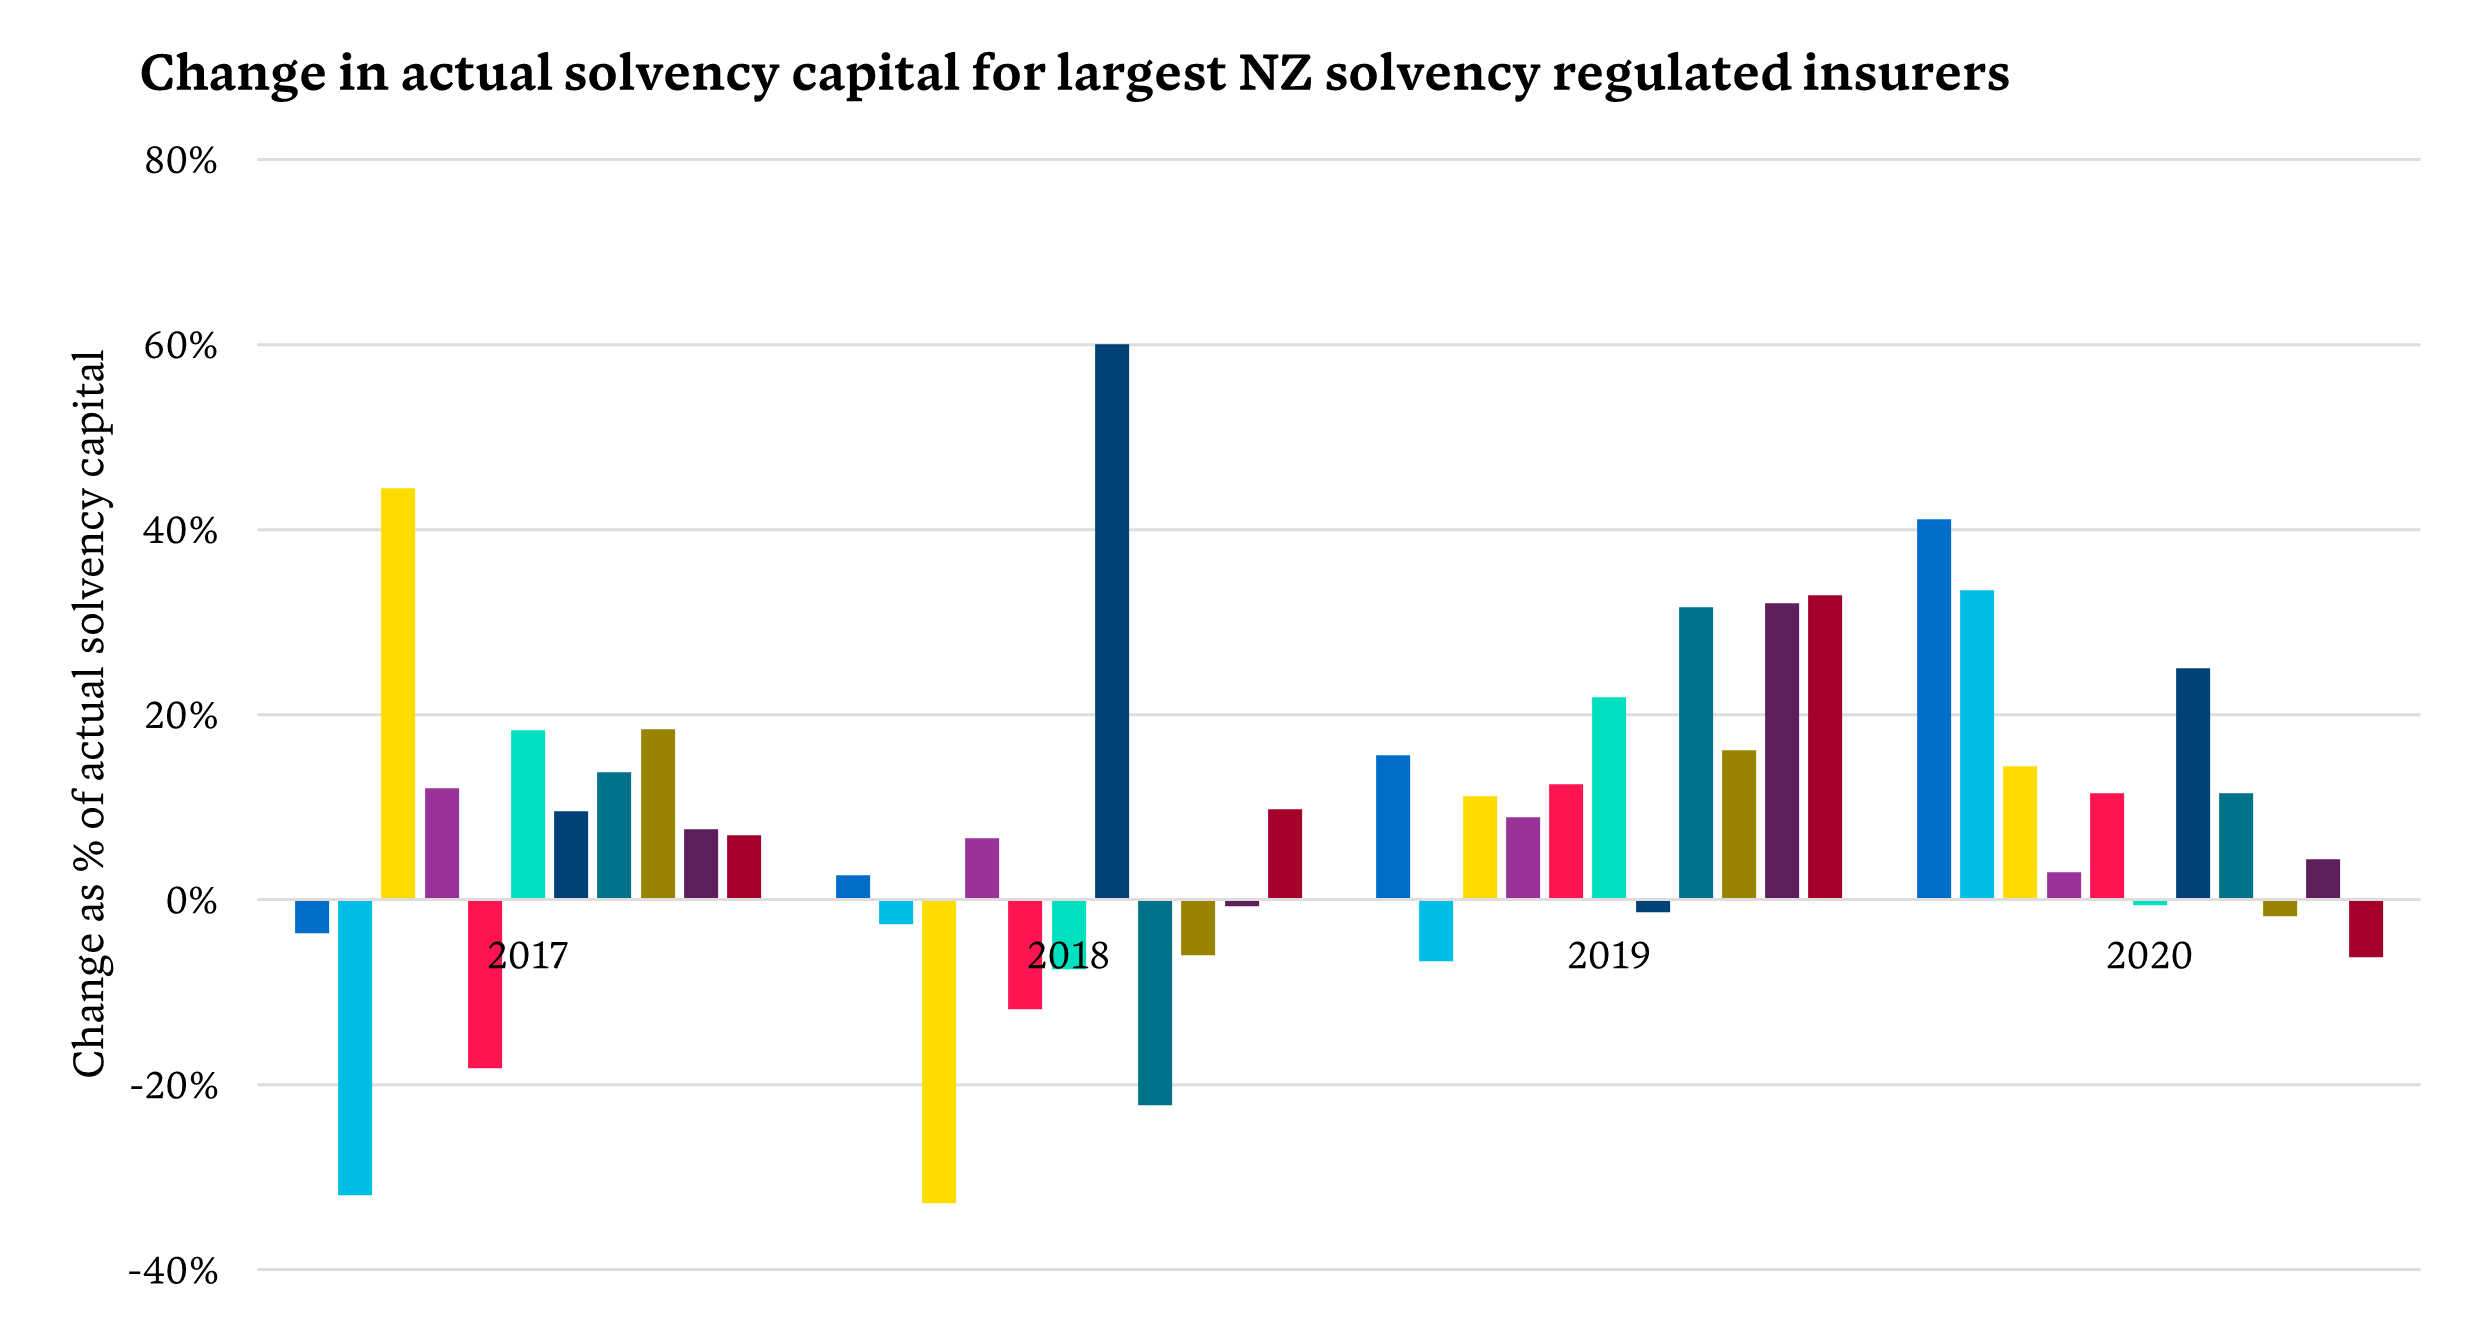
    • In July, the RBNZ wrote to insurers outlining its expectations regarding insurers’ capital positions9: given the severe economic uncertainty facing the country, it expects insurers to protect or build their capital positions. In particular, insurers should not be taking any actions that reduce capital, including any reductions due to payments of dividends. This advice makes clear that the RBNZ views the current solvency levels of insurers as being too low, despite an increase in solvency capital over the past two years for all insurers that comply with New Zealand solvency requirements (as opposed to meeting solvency through an overseas parent company). Given the likely reduction in premium volumes resulting from the economic downturn, it’s vital insurers continue to manage their claims and expense costs to maintain capital levels. It also makes sense for insurers to continually monitor their projected capital positions, which will be more uncertain over the next few years due to the unknown future effect of COVID-19.

    Source: Insurers websites/accounts from New Zealand Companies Office

    • In March, the RBNZ released the findings of its thematic review of the Appointed Actuary regime10. The main theme from the review was a need for the RBNZ to provide clarity and guidance on its expectations of the Appointed Actuary role. The review found that most insurers saw the purpose of the Appointed Actuary was to fulfil statutory requirements. The review makes it clear, however, that the RBNZ’s expectations are much wider than this. It expects the Appointed Actuary to be involved in the insurer’s strategy and be strongly engaged with the insurer’s Board and the RBNZ. Insurers will be watching out for RBNZ consultation on a purpose statement on its expectations and objectives of the Appointed Actuary role.
    • The RBNZ has also just announced the continuation of its review of the Insurance (Prudential Supervision) Act 2010, which was suspended in 2018 due to other priorities11. This review will also include a review of the associated Solvency Standards, with a likely introduction of trigger points for regulatory action based on the level of solvency ratios, compared to the current ‘pass or fail’ approach. The announcement was made by RBNZ Deputy Governor Geoff Bascand in a speech to ICNZ12, where Bascand also outlined the RBNZ’s planned response to a world of heightened risk. In particular, the key developments that insurers can expect to see “… will be more intense supervision, particularly in relation to verifying information received from insurers, and concluding enquiries more efficiently”.
    • The other area insurers will be keeping a close eye on is the EQC review. A public inquiry into the EQC was completed by Dame Silvia Cartwright in March 2020. One of the recommendations from this review was the current EQC cap on cover be lifted from $150k to $400k. The Government has accepted the intent of this recommendation and asked Treasury to consider it as part of a piece of work it’s undertaking to modernise the Earthquake Commission Act 1993 following the inquiry13. There’s a long way to go on this recommendation, but if it were undertaken by a future Government it would have a substantial impact on home insurance.

    Signs of possibility amid the challenge

    It’s fair to say 2020 has been a very unusual year and has added additional uncertainty into an industry already dealing with more than its fair share of it. The short-term uncertainty surrounding COVID-19 will be taking insurers’ immediate focus, yet longer-term risks such as climate change and regulatory developments have not diminished. New Zealand insurers have shown in their initial responses to COVID-19 a business agility and willingness to embrace change, promising signs the industry is well placed to continue adapting to an ever-changing future.

  • Modelling Victoria’s second wave of COVID-19 cases

    Last month, we looked back at the trajectory of COVID-19 in Victoria, modelling the second wave of COVID-19 cases to see how effective various restrictions were at slowing the spread of the disease. Since then, the Victorian Government has introduced several additional restrictions. In this article, we use the same modelling techniques to take a retrospective look at how effective these restrictions have been.

    In our initial analysis, we looked at COVID-19 infection data in Victoria up to 3 August. This meant we were able to estimate the impact of the various restrictions put in place in June and July, including:

    • Restrictions on family gatherings towards the end of June
    • Progressive lockdowns on 2 and 9 July
    • Introduction of mandatory facemasks on 23 July

    We found each introduced measure did lead to a reduction in the transmission rate of COVID-19. However, after the introduction of mandatory facemasks the transmission rate was balanced on a knife’s edge – while the epidemic was under control, without further measures the number of new cases would not have reduced.

    Of course, there were further measures – the full metropolitan lockdown on 2 August and the regional and business measures on 6 August, and there was some evidence at the time that a turning point might have been reached.

    Now, over a month later, no modelling is necessary to see that, indeed, the peak in cases occurred in late July/early August and has been declining since, with levels over the last few days similar to those seen back in June. The strict conditions endured by Victorians, those in Melbourne in particular, have paid off in a significantly decreased disease incidence.

    Daily reported cases of COVID-19 in Victoria

    We’ve rerun our analysis (based on that used by German researchers – Dehning et al – to measure the impact of measures at different points in time), focusing on answering the following questions:

    • With updated data (the Department of Health and Human Services in Victoria makes retrospective changes to data as more information comes to light about each case), do we still estimate an Reff of 1 after the introduction of mandatory facemasks?
    • What was the impact of the lockdown measures on 2 and 6 August?
    • What have the transmission rates been like over the past few weeks?

    What did we find?

    In the figure below, we plot the effective reproduction number as estimated by the model, and measure the change in the reproduction number between key dates, such as easing or re-introduction of restrictions. The effective reproduction number is a measure of how many people an infected individual can pass the disease onto, and it measures the trajectory of the disease. Reproduction numbers:

    • Above 1 are indicative of a growing epidemic
    • Below 1 correspond to decreasing numbers of new infections.

    Effective COVID-19 control strategies reduce the reproduction number so it is below 1. When the reproduction number is 1, new cases remain at a constant level.

    The figure below shows the estimated reproduction number from July onwards, with the corresponding numerical estimates shown in the table below. The model assumes that changes occur over a number of days, usually about 3 days, so the reproduction number estimated at the 23 July change point (0.99) is reached about 3 days afterwards, on 26 July. A similar delay affects the other points.

    Estimated reproduction rates at key dates over June, July and August

    Estimated reproduction rates at key dates over June, July and August

    Intervention dateSignificanceEstimated reproduction number following the intervention
    9-JulLockdown of Melbourne and Mitchell Shire1.4
    23-JulIntroduction of mandatory masks0.99
    2-AugLevel 4 restrictions in Melbourne0.81
    6-AugLevel 3 restrictions in regional Victoria and business restrictions0.67
    13-Aug1 week after last intervention0.55
    20-Aug2 weeks after last intervention0.53
    27-Aug3 weeks after last intervention0.51

    We see the answer to our questions in the figure and the table, namely there was:

    • A reproduction number of essentially 1 after the introduction of mandatory facemasks on 23 July, indicating case numbers would not have reduced without further interventions
    • A significant reduction in spreading rates after the introduction of Level 4 restrictions in Melbourne on 2 August
    • A further significant reduction in spreading rates after the introduction of regional and business restrictions on 6 August – prior to that a significant number of infections had been acquired at work
    • Some further reductions over the following 2 weeks, with the reproduction number estimated to be around 0.5 in late August.

    What does this mean for future case numbers?

    We’ve shown the actual and modelled case numbers below – our model used data up to 16 September so we’ve highlighted the data since then in orange. Numbers continue to trend downwards. If things stay on track, then signs are positive for Victorians, and consequently all Australians, as we head into the summer months.

    Actual and modelled daily reported cases of COVID-19 in Victoria

    A bit more on how we did it

    The methodology outlined in the paper Inferring change points in the spread of COVID-19 reveals the effectiveness of interventions combines a standard epidemiological model of disease (the SIR model) and a list of intervention dates that result in changes in underlying epidemiological parameters change. The researchers used a Markov Chain Monte Carlo method to estimate various model parameters at different points in time, and the uncertainty in these estimates. We have replicated this work for Victorian data.

    We have assumed an approximately eight-day delay between infection and identification. This consists of the total time of incubation period, onset of COVID symptoms sufficient to warrant a test, and getting and receiving test results. Roughly speaking, this means we assume cases notified today relate to infections that took place, on average, eight days ago. Since the modelling approach uses simulations, a range of delays, centred on eight days, are used in practice.

  • RADAR 2020

    Welcome to RADAR 2020, Taylor Fry’s inside look at the general insurance industry, the state of the market and what it means for insurers.

    Here’s an overview of the highlights from RADR 2020, our class-by-class analysis to the end of an eventful FY2020 …
    • While pandemic concerns have dominated headlines, the longer-term impacts and risks of a warming climate remain as urgent as ever. This shows in the overall underwriting results for general insurers, which worsened slightly over the year to FY2020, affected by catastrophic weather-related events in excess of $5.2B. The extreme bushfire season led to a NSW inquiry and a royal commission aiming to improve how we mitigate and respond to natural disasters.
    • Insurers have been significantly impacted by COVID-19, though experience varies by class of business. Travel insurance has been hit particularly hard, experiencing falls in premium and surges in claims. Ongoing uncertainty in the travel industry is also affecting staff engagement and morale. Other classes such as motor have had the lowest loss ratios on record. The ability of insurers to rely on certain forms of pandemic exclusions to deny business interruption claims is being tested in the courts. There are likely to be adverse impacts ahead for most lines of business, as poor economic conditions and increasing community hardship constrain premium increases and pressures on claims continue.
    • Regulation of insurer conduct and disclosure obligations continued to strengthen in the aftermath of the Hayne Royal Commission, heralding a cultural shift in the way insurers deal with their customers. Implementation timelines for several initiatives have been extended by six months in recognition of COVID-19, though insurers have fast-tracked their support for customers who are experiencing vulnerability and financial hardship under the new 2020 General Insurance Code of Practice.
    • Profitability for many commercial classes continue to be under pressure. Profitability for commercial property was affected by catastrophic weather events, while directors and officers have been adversely impacted by class actions over several years, with potential for the recent economic downturn to instigate further claims activity. Elevated cyber risk has also raised the potential for ‘silent cyber’ claims to impact several classes of commercial insurance, where an insurer may have to pay claims for cyber-related losses under a traditional insurance policy not designed for the purpose.
    • Insurers are anticipating an increase in primary and secondary psychological claims in workers compensation. These are expected to arise from changes to work demands, shifts in working arrangements and COVID-19-related restrictions.
    • Overall reserve releases on long-tailed classes were subdued during FY2020, which put further upwards pressure on incurred claims and loss ratios. Public and products liability as well as professional indemnity experienced reserve strengthening during FY2019 and again in FY2020, which contrasted with several years of reserve releases in the preceding years.

    Download RADAR 2020 for more expert insights on the shifts and trends in the industry to help you navigate the uncertainty and discover opportunity in our evolving insurance landscape.

    Find out more about our Appointed Actuary and General Insurance services.

  • Algorithm Charter for Aotearoa: Six things to be doing now

    The New Zealand Government has recently released its Algorithm Charter for Aotearoa New Zealand. Effectively, the Algorithm Charter is a call to action for government agencies to provide New Zealanders with the confidence that algorithms are being used sensibly and ethically. We look at how government agencies can use the Charter to drive the effective and efficient delivery of government services in New Zealand.

    Developments in computing have enabled ever increasingly sophisticated algorithms to support decision-making in all facets of our life. Algorithms are sequences of steps used to solve problems and when paired with large underlying databases for training, algorithms can help us plan and guide our lives. Alongside new playlist recommendations and advertisements for things we never knew we needed, algorithms are increasingly responsible for improvements in the quality of services offered by governments to their citizens. There are a wide range of operational functions already being guided by algorithms in New Zealand, including elective surgery prioritisation, allocation of Work and Income clients to services, and youth offending risk screening. Stats NZ’s 2018 Algorithm Assessment Report provides a useful stocktake.

    As New Zealand government organisations scale up their use of algorithms, public servants are rightly nervous about getting it right. With great power (and highly sensitive administrative data) comes great responsibility, and highly publicised overseas government algorithm fails (for example, policing algorithms were judged to be racist) are front of mind for many.

    What are the major risks when using algorithms for government decision making?

    Algorithms encompass simple techniques, such as regression models and decision trees (which can be used to make predictions and streamline business processes), through to more complex approaches like neutral networks and ensemble models (closer to machine learning). Ideally, they streamline processes, make predictions, and reveal insights about problems in a way not possible for the human mind alone. However, if algorithms are not built with care they can be ineffective, or at worst dangerous.

    The major risks to be aware of when using algorithms for government decision making need to be clear. These include:

    Unfairness

    The data used, or the way the algorithm is built can result in some sectors of society being unfairly targeted (or not targeted) by the services informed by the algorithm. For example, earlier this year, an African American man in Michigan was wrongfully arrested and held in a detention centre for nearly 30 hours after facial recognition technology incorrectly identified him as a suspect in a shoplifting case. Relatedly, the U.S. Department of Commerce’s National Institute of Standards and Technology’s Face Recognition Vendor Test looked at 189 software algorithms from 99 developers and found higher rates of false positives for Asian and African American faces relative to images of Caucasians.

    Government agencies need to be particularly sensitive to ensuring the fairness of their algorithms, as they must meet human rights legislation which prohibits discrimination on the grounds of gender, sexual orientation, religious and ethical beliefs, colour, race, ethnicity, disability, age, marital status, political opinion, employment status and family status. However, satisfying ‘fairness’ criteria across all of these measures at the same time may prove challenging, and organisations will need to understand the trade-offs and make clear determinations on which they are adhering to, and why.

    Ensuring fairness may mean some variables need to be restricted from being used as inputs to an algorithm, but grey areas remain. For example, if ‘gender’ is restricted, a secondary variable used as an input, such as ‘hobby’, might be strongly correlated. So as a result, the algorithm could inadvertently discriminate based on gender anyway.

    Accountability

    How algorithms inform decisions may not be clear, meaning that biases may go undetected. This makes clear lines of accountability critical. Without clear accountability, the safe implementation of an algorithm will be jeopardised. Machine learning and AI algorithmic techniques are particularly prone to ‘black box’ executions, where deciphering how the algorithm works is difficult. But it doesn’t have to be this way. Interpretable ‘glass box’ algorithms that facilitate strong lines of accountability are entirely feasible when the right techniques are employed. Our recent article, Interpretable machine learning: what to consider discusses these issues in more detail.

    Lack of transparency and consequently accountability were an issue for Microsoft when, in 2016, it launched a chat bot on Twitter called Tay. It was programmed to learn how to interact like a real human, through reading and processing real tweets. However, human oversight was lacking as the black box model evolved and within hours it transformed from an innocent bot into an offensive, loud-mouthed racist.

    Ongoing alignment with rules and policy

    Periodic review of algorithms to ensure they remain fit for purpose may not occur, and human oversight, an essential component in protecting against sub-optimal outcomes and perverse incentives, may not be retained beyond an initial implementation period. While algorithms can inform targeting of services and save time, they need to align with the problem to be solved and should be updated as the broader environment evolves. The Australian’s Government’s ‘Robodebt’ saga is a cautionary tale. The Online Compliance Intervention was an automated debt recovery program introduced in mid-2016 in an attempt to ensure recipients of welfare benefits were not under-reporting their income and, as a result, over-receiving welfare payments. Almost half a million Australians received correspondence regarding overpayments, but hundreds of thousands of the assessments appeared wrong, because the algorithms had included income from other periods, where people were actually in paid employment and not claiming benefits. The Australian Government is now paying refunds to all 470,000 Australians who had their debt calculated using this income averaging methodology. Human oversight is critical to the safe operation of algorithms and a social licence to do so.

    The issues we’ve briefly highlighted are all inter-related. Algorithms need to get it right, every time, because any single issue can erode public confidence irrevocably, no matter how effective the algorithm is.

    Where does the Algorithm Charter for Aotearoa fit in?

    Recognising these risks of mismanagement, the New Zealand government recently released the Algorithm Charter for Aotearoa New Zealand. It positions New Zealand as a world leader in setting standards to guide the use of algorithms by public agencies. Many government agencies have already signed up to the charter. The charter includes several commitments designed to ensure the appropriate management of the risks outlined above.

    What should agencies do to ensure they are implementing the Charter well?

    The Algorithm Charter for Aotearoa New Zealand is an enabler. By abiding by standards of fairness and transparency set out in the charter, government agencies can improve public confidence in the use of algorithms in government decision making. Without it, the use of algorithms may continue to be met with community resistance. Ideally, greater public trust, built on the foundations of this charter, will lead to greater use of algorithms (and leveraging of data more broadly), and ultimately more effective and efficient government services. A win for service users, communities and government agencies alike.

    We outline six things government agencies can do to position themselves well for implementing the charter:

    1. Review your services and identify which are informed by algorithms.

    Government agencies should perform a stocktake of all algorithms that are informing operational decisions. In most cases the relationship between a service and an algorithm is direct, for example, an algorithmic tool that informs the prioritisation of patients for surgery. However, sometimes the relationship may not be direct, such as when output from one algorithm is hard coded into another. Expert advice may be beneficial to support a stocktake.

    1. Prioritise algorithms for review.

    The Algorithm Charter offers an easy rule-of-thumb approach, suggesting government agencies rate each algorithm based on:

    • The likelihood of unintended adverse outcomes arising from use of the algorithm
    • The impact that unintended adverse outcomes would have on New Zealanders

    This rule of thumb is useful for an initial high-level prioritisation, however judging the likelihood of unintended adverse outcomes may be more difficult, particularly where the algorithm lacks transparency. In such cases, it will be beneficial to gather together subject matter and technical experts to work through the implications.

    1. Peer review (in priority order) algorithms against the Algorithm Charter commitments.

    Peer reviews should be thorough. Identifying bias in algorithms can be the most difficult, but arguably the most important, aspect of a review.

    Public confidence in any review is likely to be enhanced if it is independent from the creators and end-users of the algorithm.

    1. Adjust algorithms where they do not meet Algorithm Charter commitments fully.

    Modern algorithmic techniques can be employed to address most issues. Transparent, interpretable algorithms are entirely possible. And while building public confidence in the use of algorithms may take time, it is an attainable outcome if charter commitments are adhered to.

    It will be beneficial at this stage to think about what might be considered fair or unfair by society in terms of the way the algorithm affects decisions. Any adjustments to algorithms will need to be designed with fairness in mind.

    Releasing public advice that a review has been undertaken and that some algorithms have been adjusted as a result will help make it clear that algorithms are being effectively monitored under the charter.

    1. Put in place a periodic review process for each algorithm.

    The regularity and depth of periodic reviews for each algorithm should be commensurate with the assessed likelihood and impact of unintended adverse outcomes. Your organisation should also have a management plan in place for its algorithms in the event they result in unintended consequences for New Zealanders. The plan should become operational as soon as issues are identified.

    1. Set up guidelines for the development and management of new algorithms.

    The Algorithm Charter puts in place generic commitments. Each government agency will need its own set of more detailed guidelines for new algorithms. These will need to reflect the nature of the services a particular government agency provides, the sensitivity of service users to the use of algorithms, and the use of their data to inform them. For example, high sensitivity over the use of personal health data may dictate specific guidelines relating to the use of algorithms in the health sector.

    Embrace the opportunities presented by the Algorithm Charter

    While the scale of implementing the Algorithm Charter for Aotearoa shouldn’t be underestimated, there is a substantial upside to getting it right. Increased public trust in governments using algorithms for good should provide decision makers with more confidence to identify new opportunities to improve services using algorithms. This would be of particular benefit in fields where lack of confidence has previously prevented their use.